Smart Meters Quadrant Report
Smart meters are next generation metering devices that allow for remote data collection and periodic communication on consumers’ usage to the utility. For utilities, implementation of smart meter helps in accurate billing, dynamic tariff adoption, and effective monitoring and integration of new utility resources. For consumers, smart meters offer a better understanding of their usage or consumption patterns, easier supplier switching, and better fault detection and clearance. Globally, smart meter projects are mainly implemented across residential, commercial, and industrial end-users.
The global smart meters market size is expected to grow to USD 29 billion by 2025, at a CAGR of 6.7%. The growth of the smart meter market during the forecast period is attributed to the planned and mandated rollout of smart meter projects across major countries in North America, South America, Europe, Asia Pacific, and Middle East & Africa regions.
Planned and mandated rollout of smart meter projects across major countries to drive the growth of smart meters market
This report identifies and benchmarks the best smart meter vendors globally such as Schneider Electric (France), Landis+Gyr (Switzerland), Itron (US), Siemens (Germany), Wasion Group (China), Badger Meter (US), and Sensus (Xylem) (US) and evaluates them on the basis of business strategy excellence and strength of product portfolio within the smart meters ecosystem, combining inputs from various industry experts, buyers, and vendors, and extensive secondary research including annual reports, company press releases, investor presentations, free and paid company databases. They are rated and positioned on a 2x2 matrix, called as ‘Company Evaluation Quadrant’, and identified as Visionary Leaders (top companies), Dynamic Differentiators, Innovators, or Emerging companies.
The report includes market-specific company profiles of 20 top smart meter vendors globally and assesses the recent developments that shape the competitive landscape of this highly fragmented market. An in-depth analysis of the best smart meters vendors is done at a granular level to create this report.
List of companies evaluated and profiled in the report:
- ACLARA TECHNOLOGIES
- BADGER METER
- EDMI
- GENUS POWER INFRASTRUCTURES
- HEXING ELECTRICAL
- HONEYWELL INTERNATIONAL
- ISKRAEMECO
- ITRON
- JIANGSU LINYANG ELECTRONICS
- KAMSTRUP
- LANDIS+GYR
- LARSEN & TOUBRO
- NETWORKED ENERGY SERVICES CORPORATION
- PIETRO FIORENTINI
- SAGEMCOM
- SCHNEIDER ELECTRIC
- SECURE METERS
- SENSUS (XYLEM)
- SIEMENS
- WASION GROUP
Table of Contents
1 Introduction
1.1 Definition
1.1.1 Smart Meters Market, By Type: Inclusions & Exclusions
1.1.2 Smart Meters Market, By Component: Inclusions & Exclusions
1.1.3 Smart Meters Market, By Communication Type: Inclusions & Exclusions
1.1.4 Smart Meters Market, By Technology: Inclusions & Exclusions
1.1.5 Smart Meters Market, By End-User: Inclusions & Exclusions
2 Market Overview
2.1 Introduction
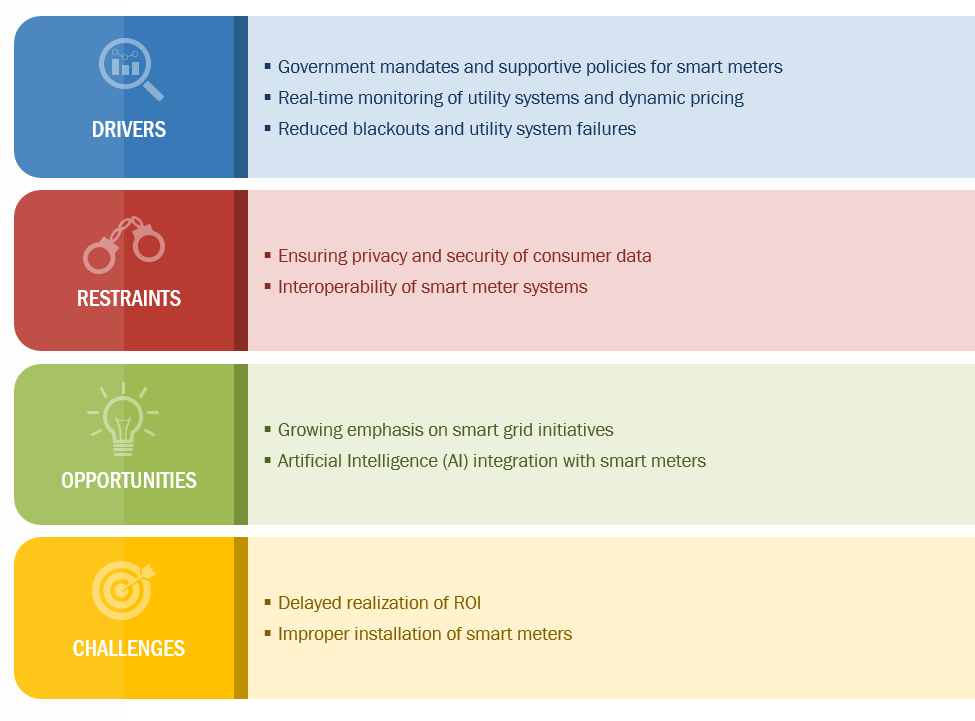
2.2 Market Dynamics
Figure 1 Smart Meters Market: Market Dynamics
2.2.1 Drivers
2.2.1.1 Government Mandates and Supportive Policies for Smart Meters
2.2.1.2 Real-Time Monitoring of Utility Systems and Dynamic Pricing
Table 1 Types of Dynamic Pricing of Utilities
2.2.1.3 Reduced Blackouts and Utility System Failures
2.2.2 Restraints
2.2.2.1 Ensuring Privacy and Security of Consumer Data
2.2.2.2 Interoperability of Smart Meter Systems
2.2.3 Opportunities
2.2.3.1 Growing Emphasis on Smart Grid Initiatives
Figure 2 Investment in Smart Grid By Technological Area, 2014-2018, Billion USD
2.2.3.2 Artificial Intelligence (AI) Integration With Smart Meters
2.2.4 Challenges
2.2.4.1 Delayed Realization of ROI
2.2.4.2 Improper Installation of Smart Meters
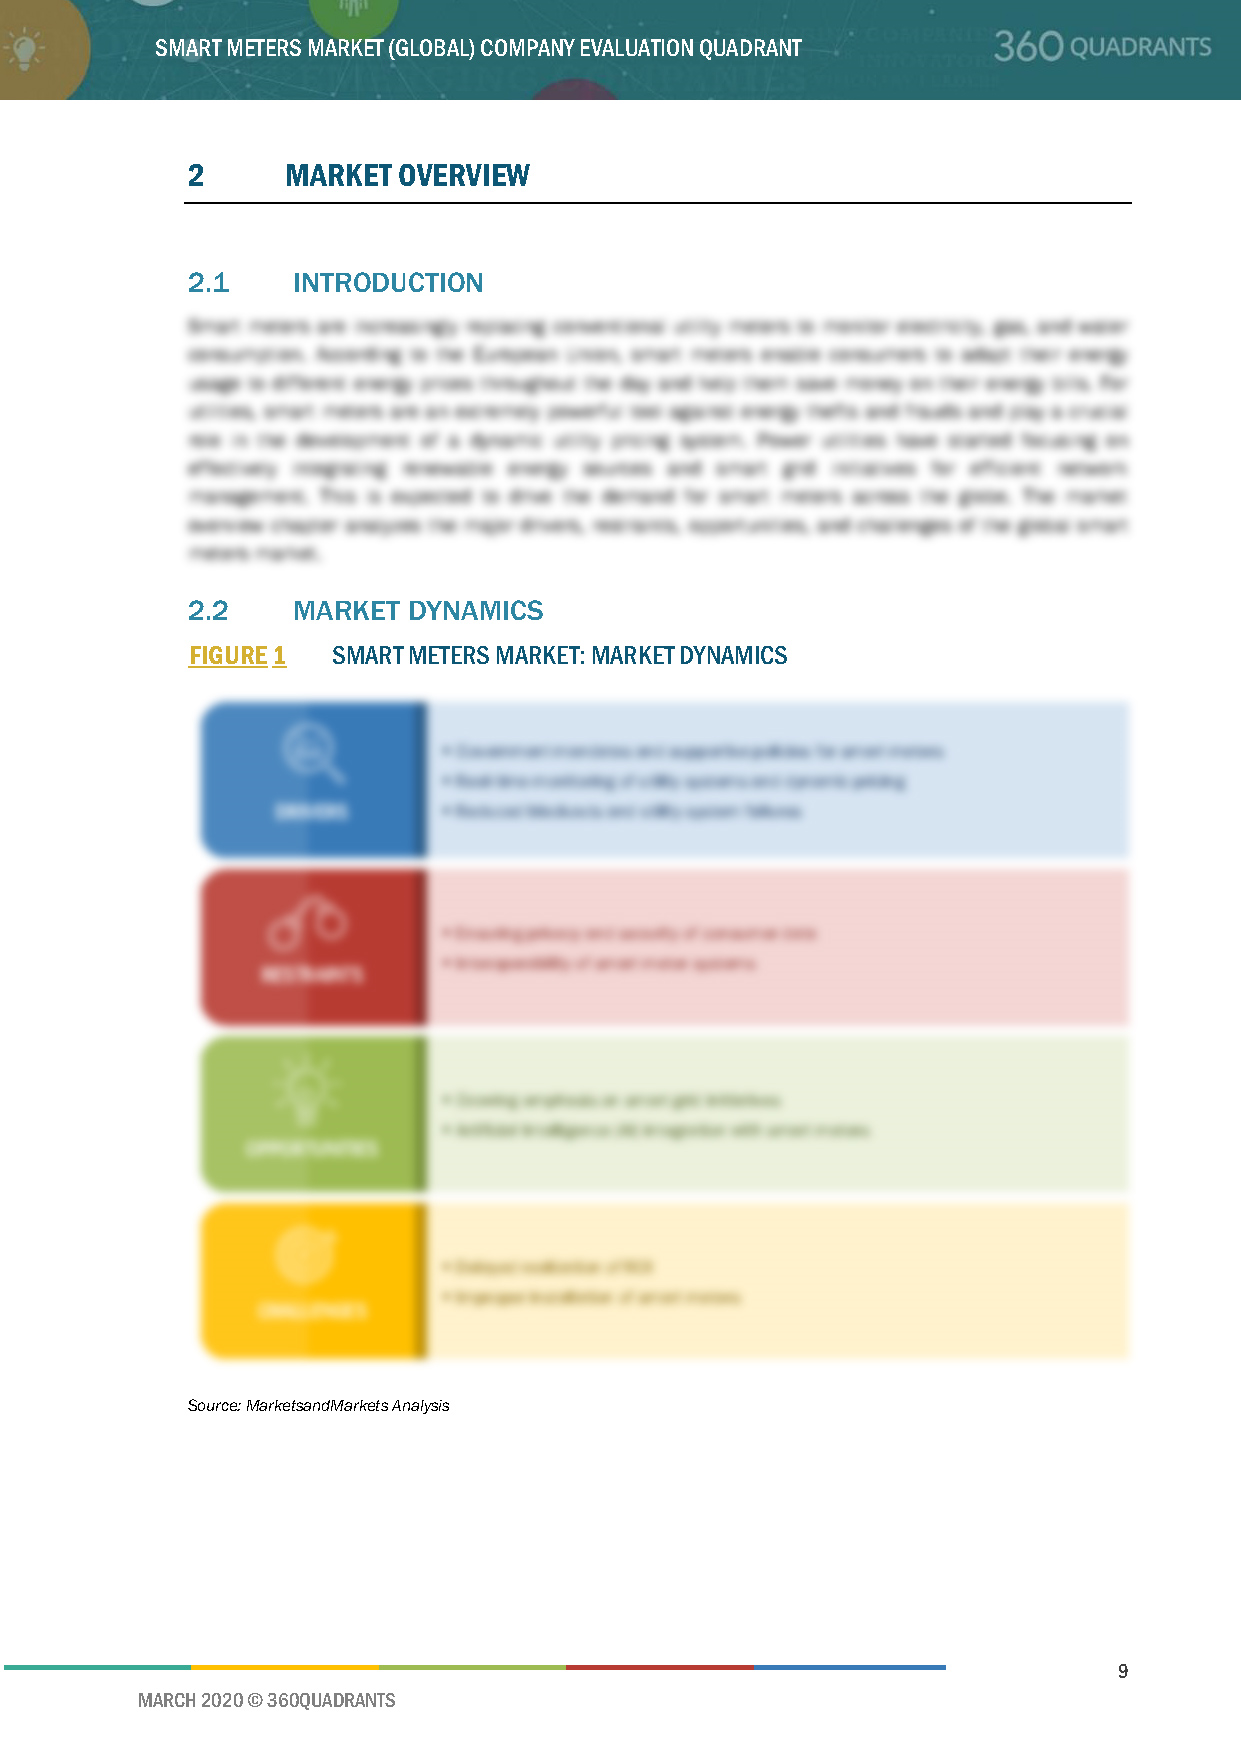
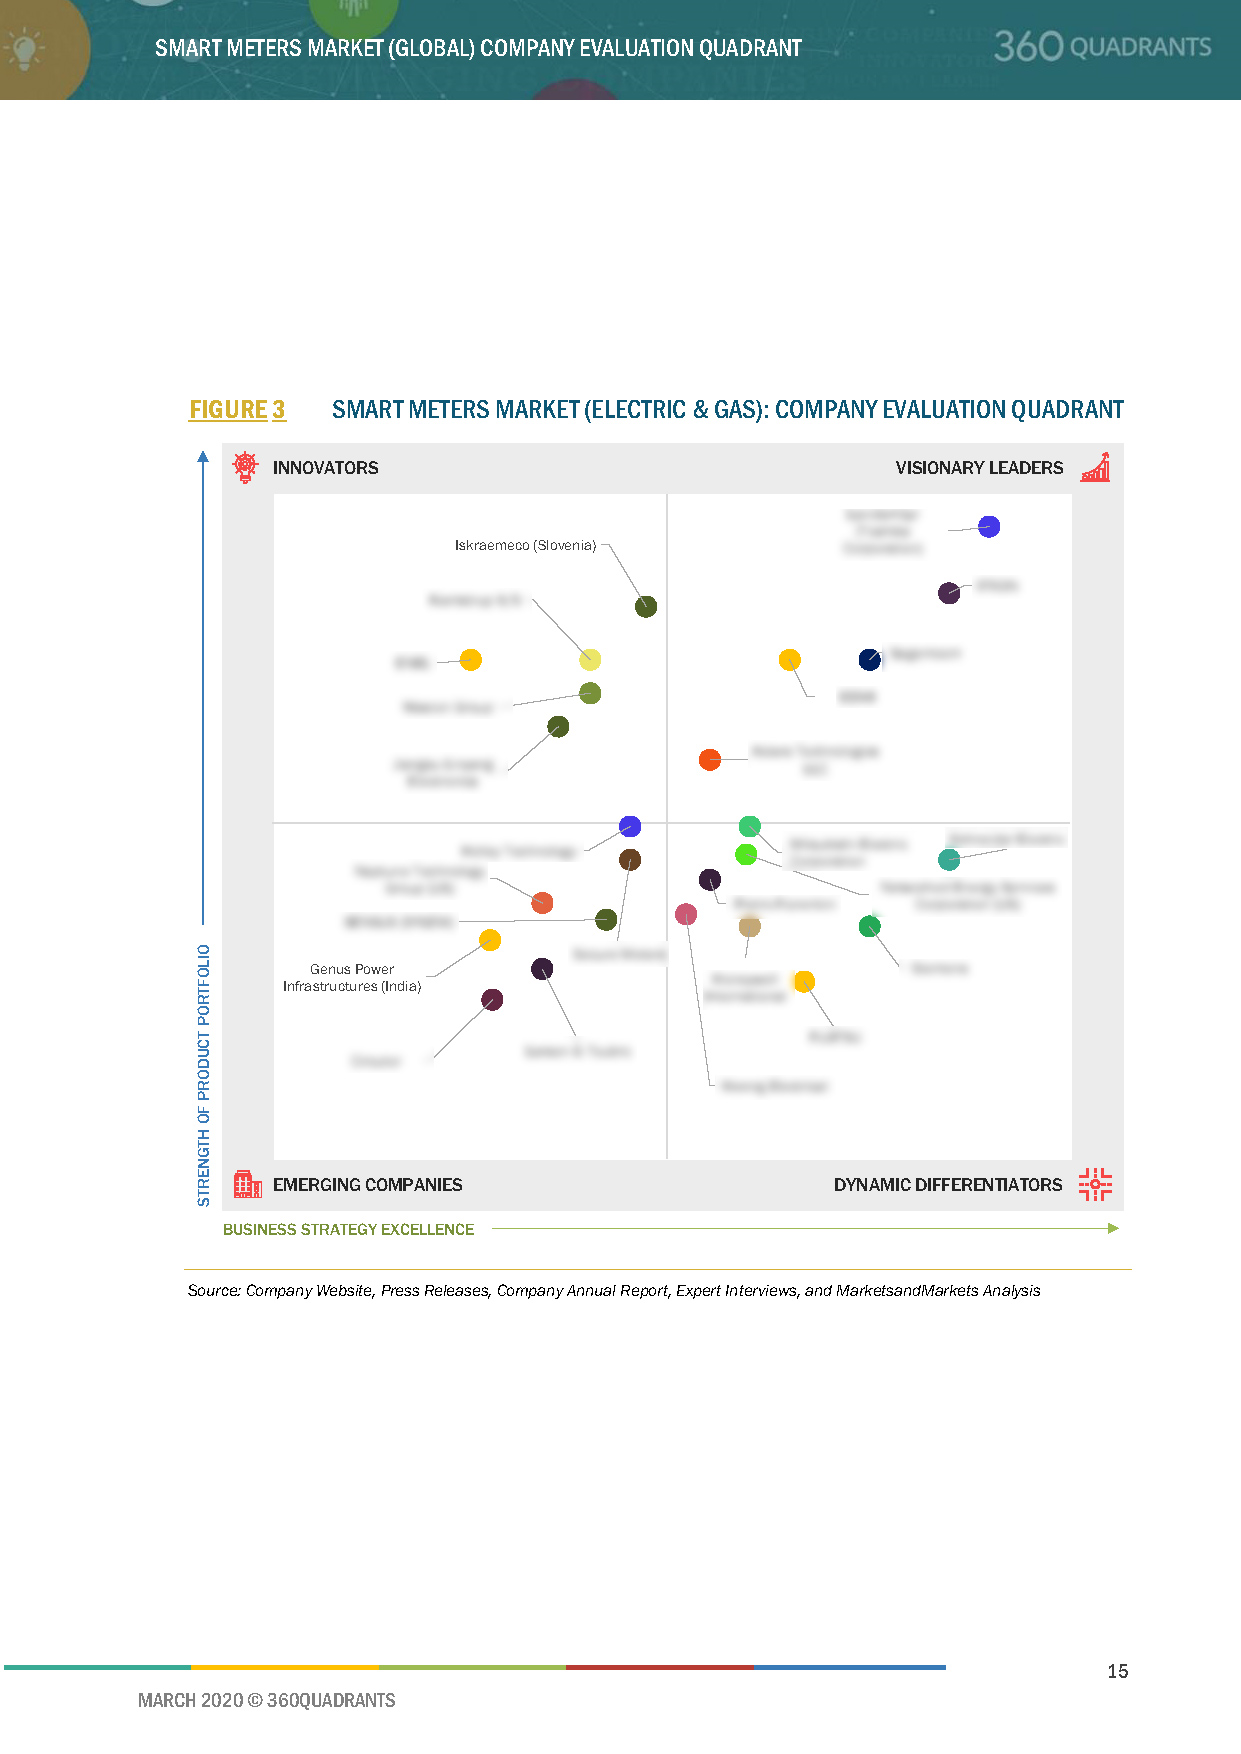
3 Company Evaluation Quadrant
3.1 Company Evaluation Quadrant (Electric & Gas)
3.1.1 Visionary Leaders
3.1.2 Innovators
3.1.3 Emerging Companies
3.1.4 Dynamic Differentiators
Figure 3 Smart Meters Market (Electric & Gas): Company Evaluation Quadrant
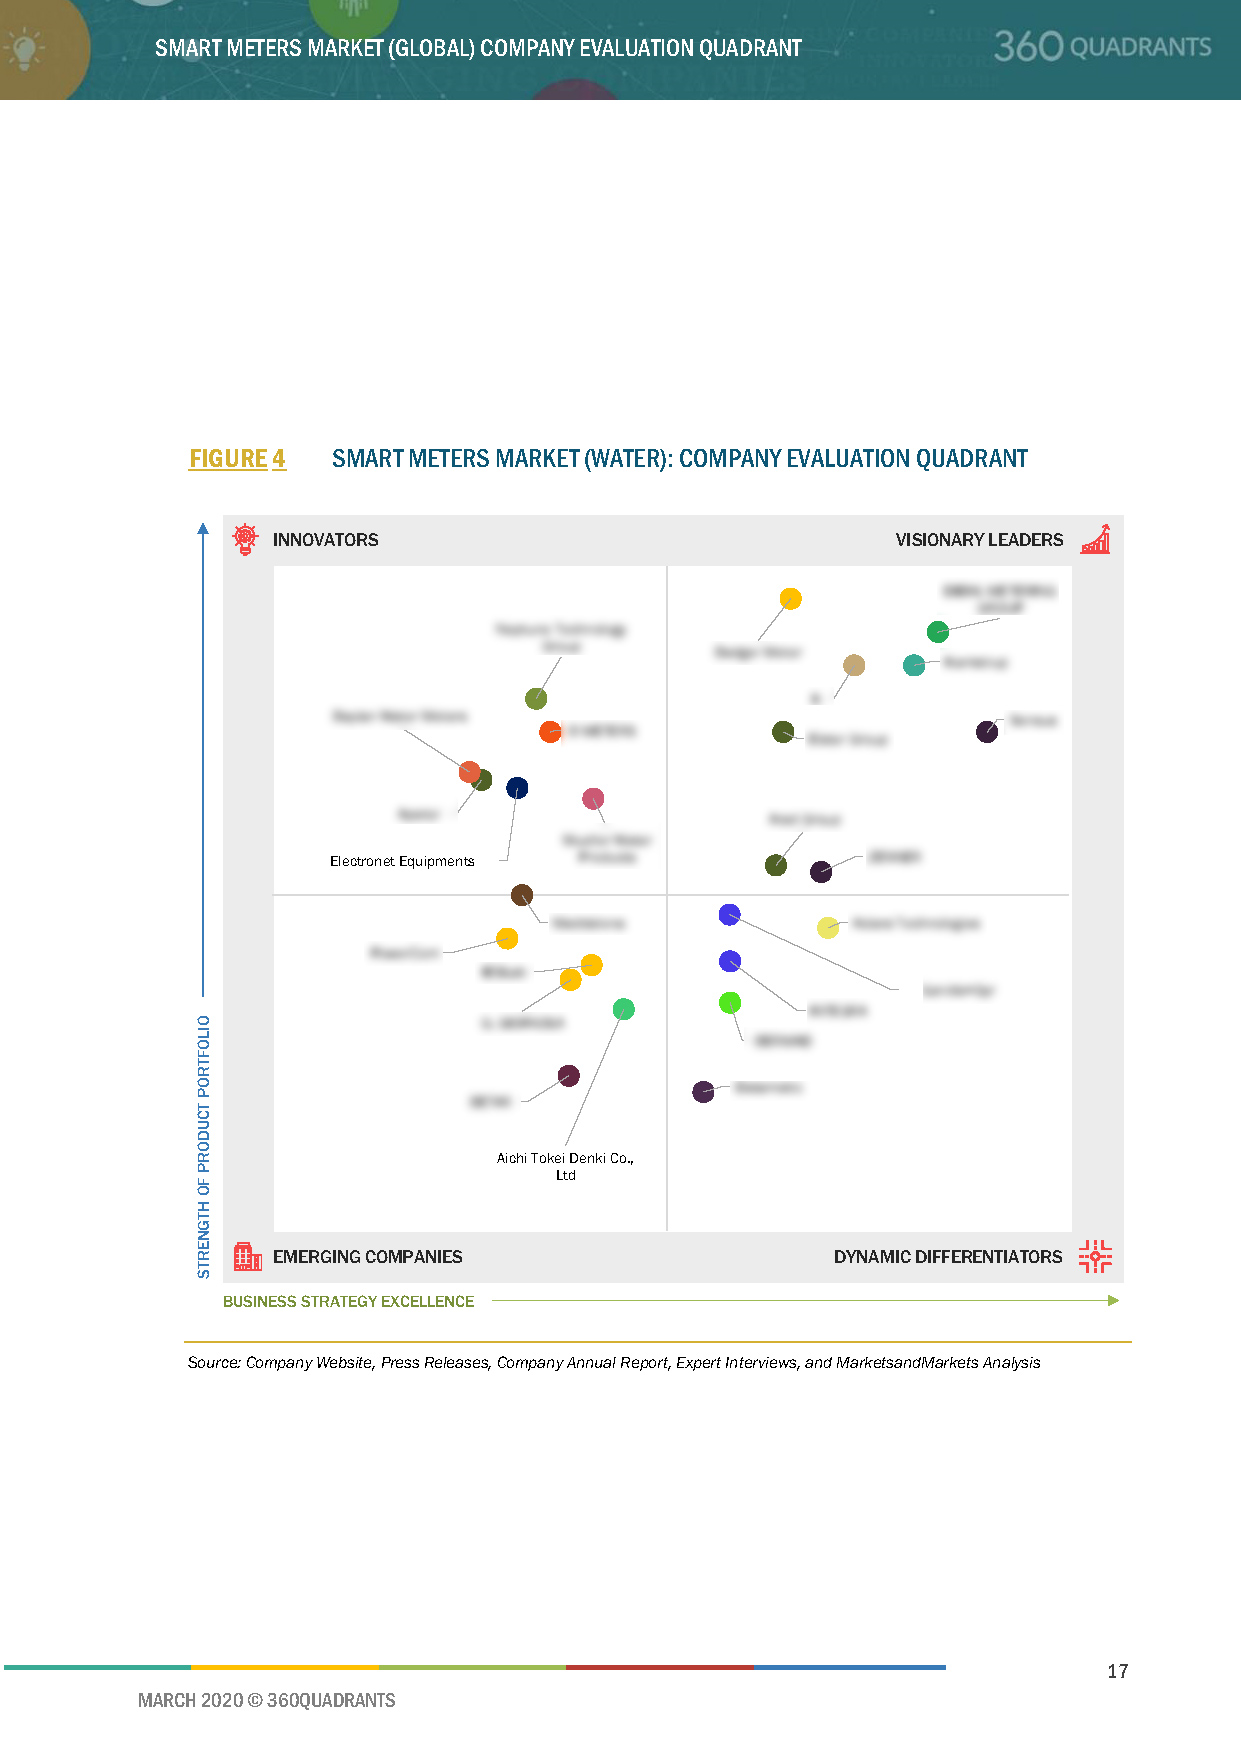
3.2 Company Evaluation Quadrant (Water)
3.2.1 Visionary Leaders
3.2.2 Innovators
3.2.3 Emerging Companies
3.2.4 Dynamic Differentiators
Figure 4 Smart Meters Market (Water): Company Evaluation Quadrant
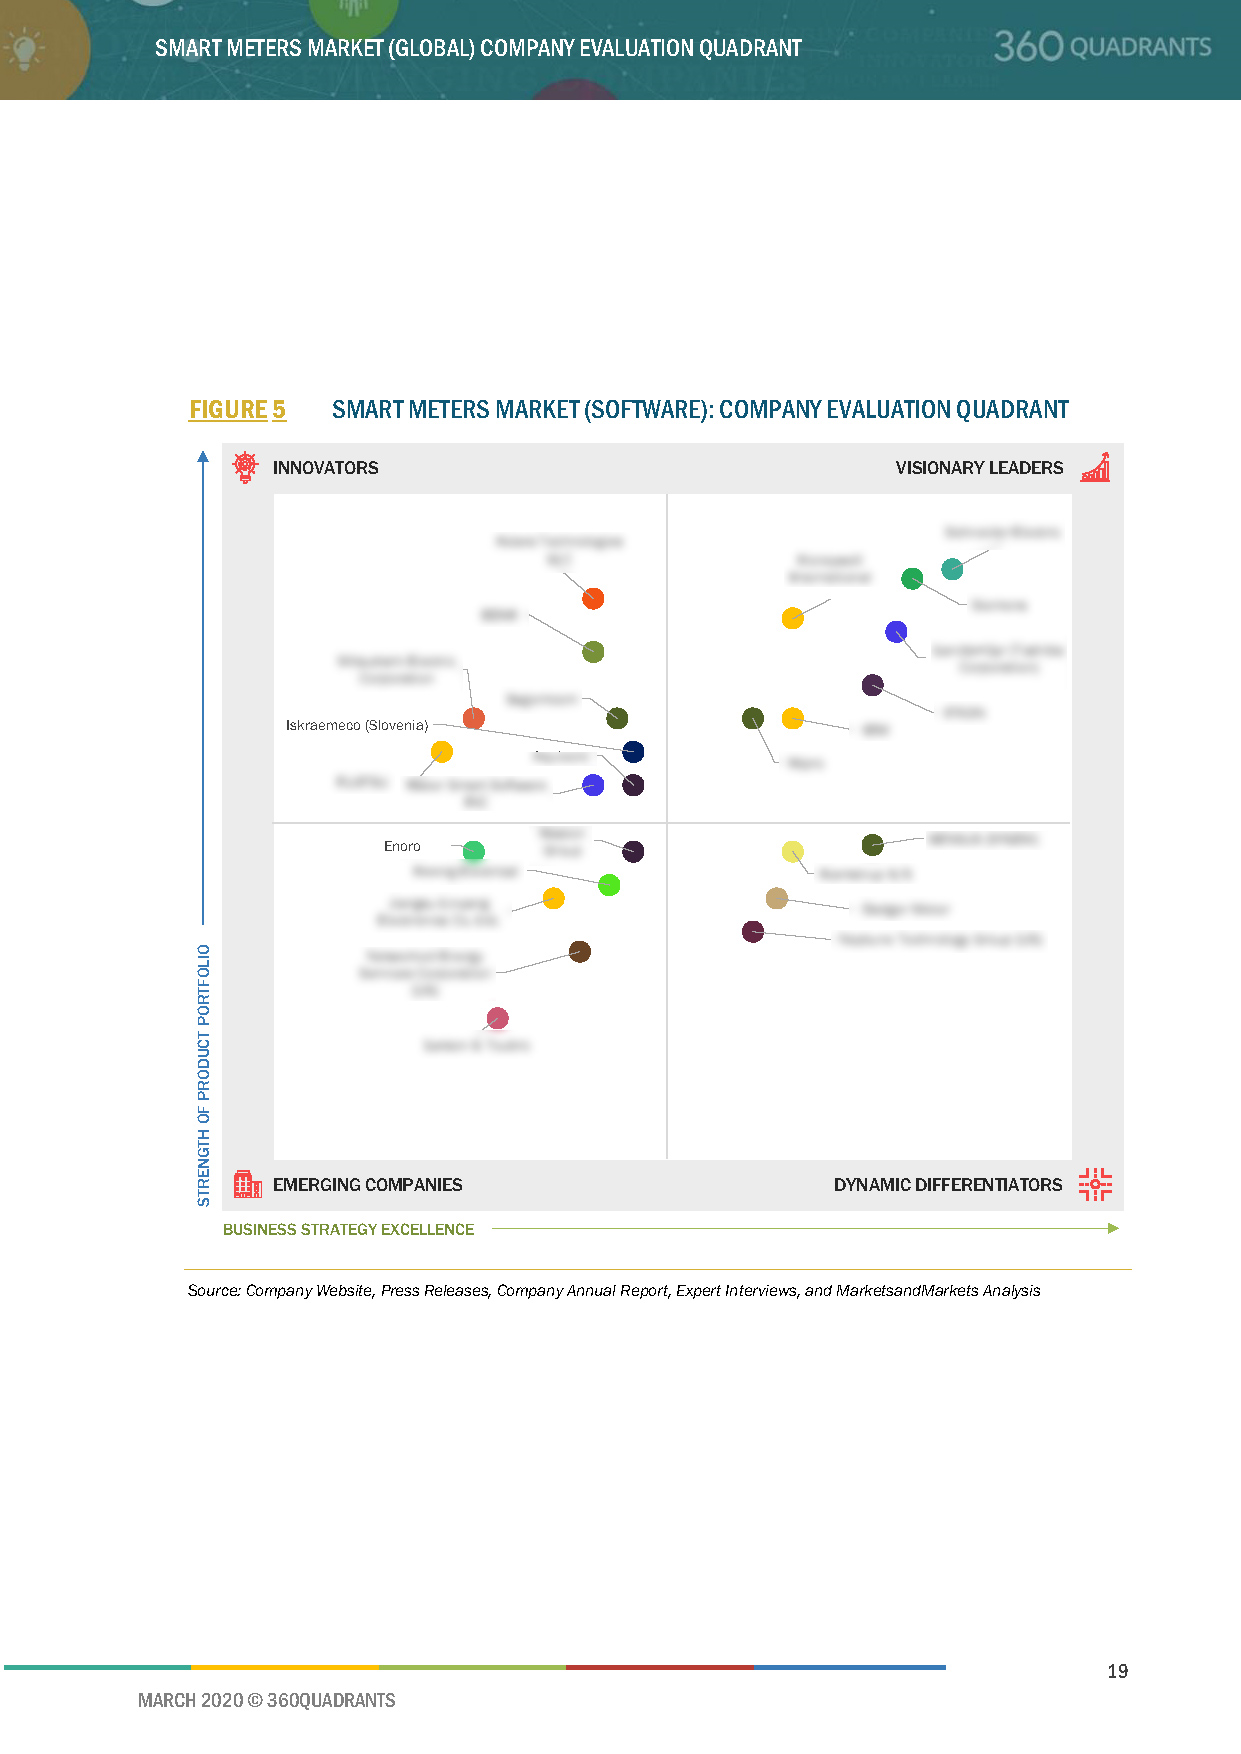
3.3 Company Evaluation Quadrant (Software)
3.3.1 Visionary Leaders
3.3.2 Innovators
3.3.3 Emerging Companies
3.3.4 Dynamic Differentiators
Figure 5 Smart Meters Market (Software): Company Evaluation Quadrant
4 Competitive Landscape
4.1 Overview
Figure 6 Key Developments in the Smart Meters Market, 2017 - February 2020
4.2 Market Share, 2019
Figure 7 Smart Meters Market in 2019
4.3 Competitive Scenario
Table 2 Developments By Key Players in the Market, January 2016–February2020
4.3.1 New Product Developments
4.3.2 Investments & Expansions
4.3.3 Mergers & Acquisitions
4.3.4 Contracts & Agreements
4.3.5 Partnerships
5 Company Profiles
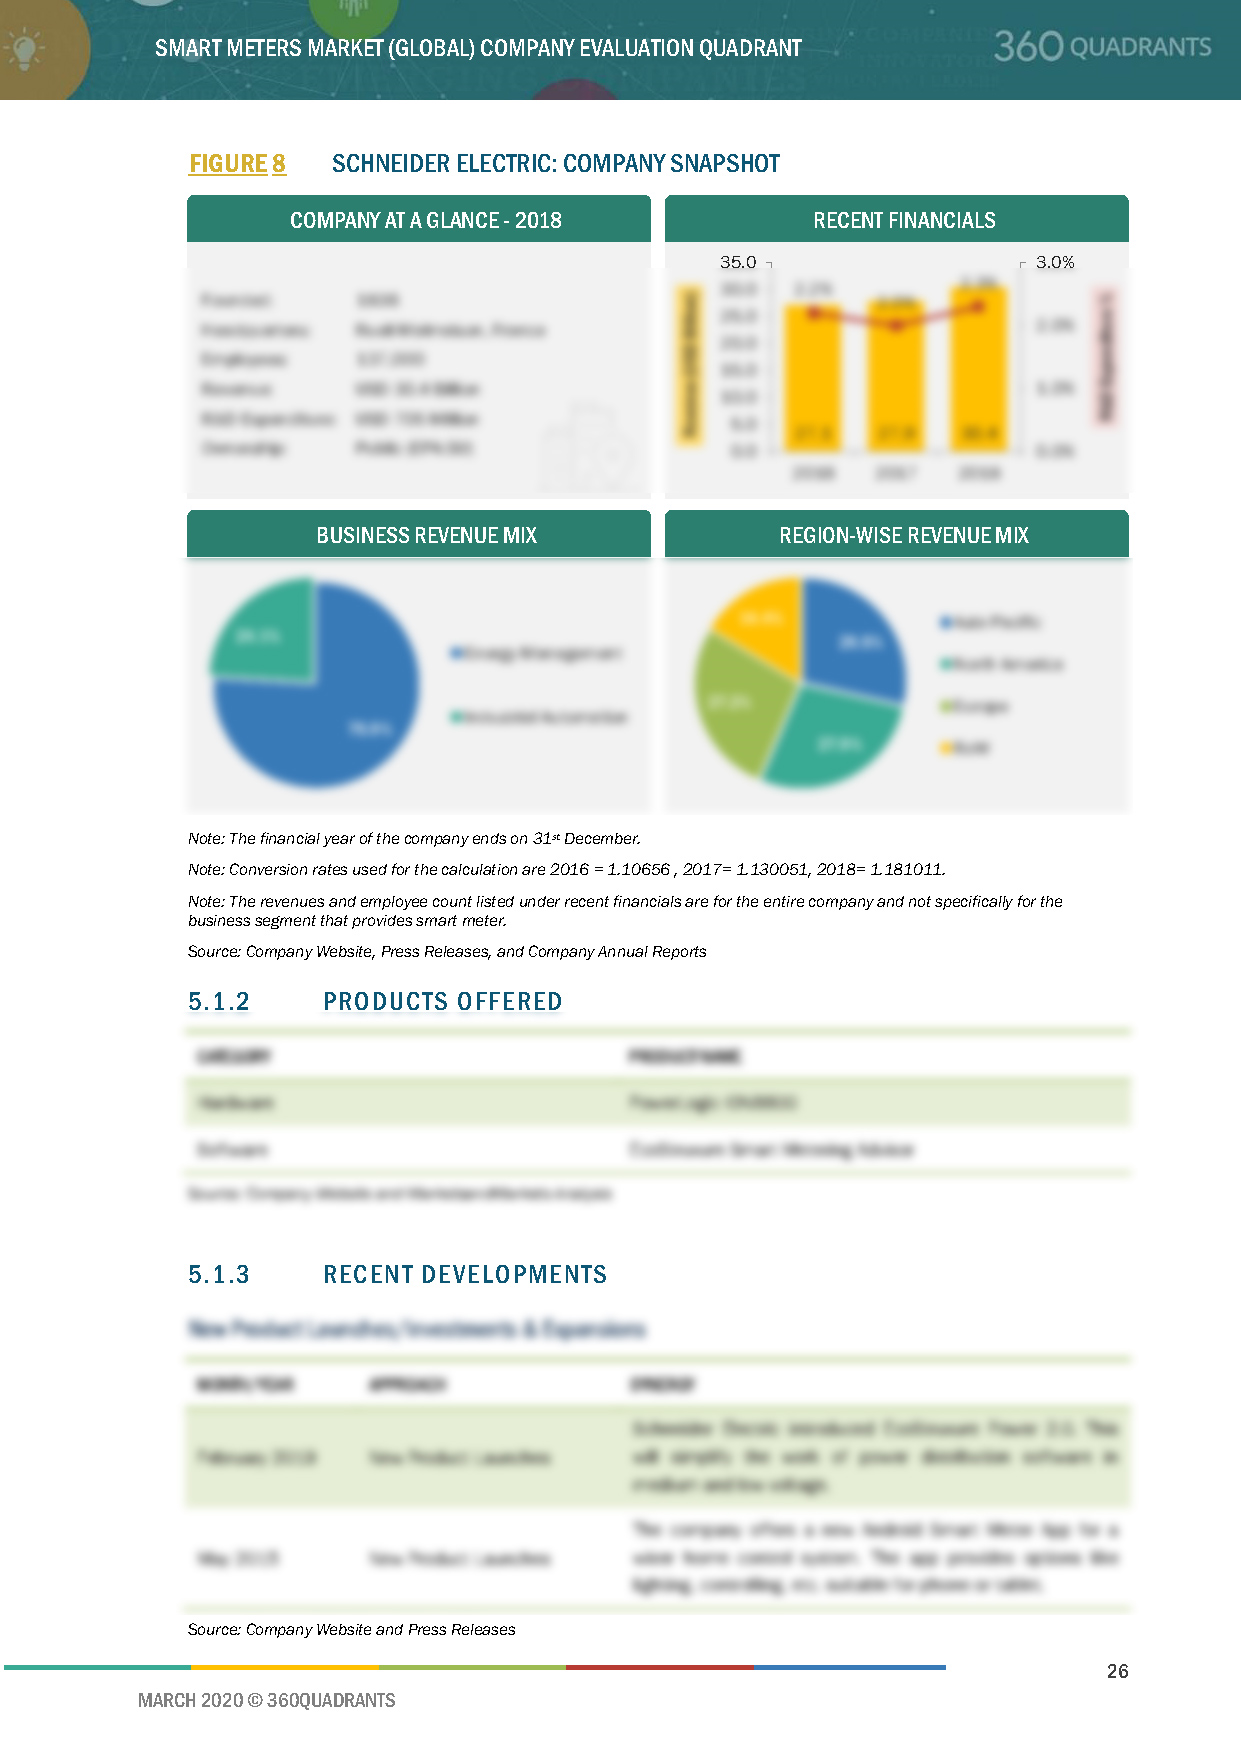
5.1 Schneider Electric
5.1.1 Business Overview*
Figure 8 Schneider Electric: Company Snapshot
5.1.2 Products Offered*
5.1.3 Recent Developments*
5.1.4 SWOT Analysis*
Figure 9 Schneider Electric: SWOT Analysis
5.1.5 MnM View*
(*Above sections are present for all of below companies)
5.2 Landis+Gyr
Figure 10 Landis+Gyr: Company Snapshot
Figure 11 Landis+Gyr: SWOT Analysis
5.3 Itron
Figure 12 Itron: Company Snapshot
Figure 13 Itron: SWOT Analysis
5.4 Siemens
Figure 14 Siemens: Company Snapshot
Figure 15 Siemens: SWOT Analysis
5.5 Wasion Group
Figure 16 Wasion Group: Company Snapshot
Figure 17 Wasion Group: SWOT Analysis
5.6 Badger Meter
Figure 18 Badger Meter: Company Snapshot
Figure 19 Badger Meter: SWOT Analysis
5.7 Sensus (Xylem)
Figure 20 Sensus (Xylem): Company Snapshot
Figure 21 Sensus (Xylem): SWOT Analysis
5.8 Honeywell International
Figure 22 Honeywell International: Company Snapshot
5.9 Larsen & Toubro
Figure 23 Larsen & Toubro: Company Snapshot
5.10 Kamstrup
Figure 24 Kamstrup: Company Snapshot
5.11 Genus Power Infrastructures
Figure 25 Genus Power Infrastructures: Company Snapshot
5.12 Aclara Technologies
5.13 EDMI
5.14 Sagemcom
5.15 Iskraemeco
6 Appendix
6.1 Other Significant Players
6.1.1 Jiangsu Linyang Electronics
6.1.2 Hexing Electrical
6.1.3 Networked Energy Services Corporation
6.1.4 Pietro Fiorentini
6.1.5 Secure Meters
6.2 Methodology
6.3 List of Abbreviations
This report identifies and benchmarks the best smart meter vendors globally such as Schneider Electric (France), Landis+Gyr (Switzerland), Itron (US), Siemens (Germany), Wasion Group (China), Badger Meter (US), and Sensus (Xylem) (US) and evaluates them on the basis of business strategy excellence and strength of product portfolio within the smart meters ecosystem, combining inputs from various industry experts, buyers, and vendors, and extensive secondary research including annual reports, company press releases, investor presentations, free and paid company databases. They are rated and positioned on a 2x2 matrix, called as ‘Company Evaluation Quadrant’, and identified as Visionary Leaders (top companies), Dynamic Differentiators, Innovators, or Emerging companies.
SAMPLES:
- Updated version of this Quadrant
- Different Company Evaluation Quadrant
- 'Startup Only' Company Evaluation Quadrant
- Region or Country specific evaluation
- Application or Industry specific evaluation ..Read More
- Submit a Briefing Request
- Question about our published research
- Request for evaluation of your organization for specific market
- Request for re-evaluation of Company Evaluation Quadrant ..Read More