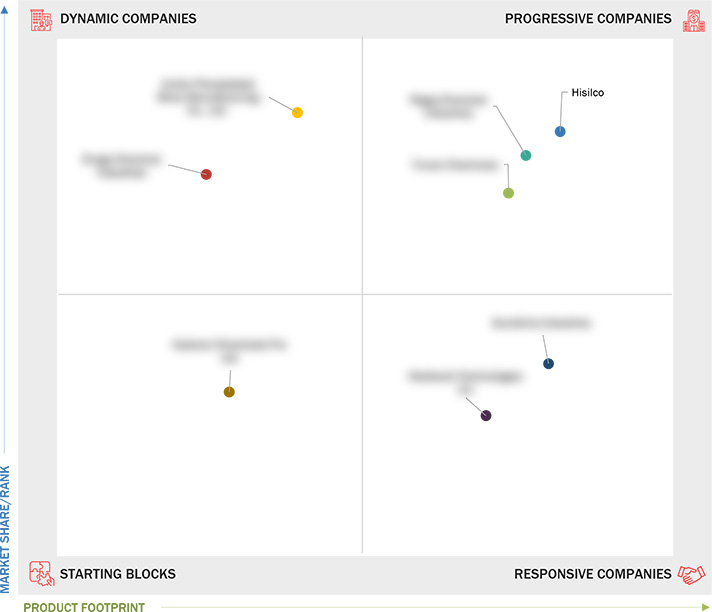
Comparing 8 vendors in Precipitated Silica Startups across 0 criteria.
The 2025 Precipitated Silica Market Report highlights the dynamic growth of the precipitated silica industry, which is driven primarily by the demand in rubber and tire applications, enhanced by ongoing innovations. This industry is set to grow substantially from 2024 to 2030, with a projected CAGR of 5.1%, increasing the market value from USD 4,206.1 million to USD 5,990.9 million. The growth is fueled by increased consumption in the rubber industry, where precipitated silica serves as a reinforcing agent, improving tire performance and longevity, particularly in the burgeoning market for eco-friendly 'green' tires.
Market Leadership Quadrant
1.1 Study objectives
1.2 Market Definition
1.3 Market Scope
1.3.1 Market Segmentation and Regional Scope
1.3.2 Inclusions and Exclusions
1.3.3 Years Considered
1.3.4 Currency Considered
1.3.5 Units Considered
1.4 Stakeholders
2.1 INTRODUCTION
2.2 MARKET DYNAMICS
2.3 DRIVERS
2.3.1 Increasing demand from rubber and tire industries
2.3.2 Increased agricultural applications
2.3.3 Expansion in cosmetics and personal care industry
2.4 RESTRAINTS
2.4.1 Environmental and regulatory challenges
2.4.2 Health and safety concerns
2.5 OPPORTUNITIES
2.5.1 Increasing demand for processed and packaged foods
2.5.2 Expansion in electric vehicle (EV) market
2.6 CHALLENGES
2.6.1 Volatility in raw material supply
2.6.2 Competition from substitutes
2.7 VALUE CHAIN ANALYSIS
2.8 ECOSYSTEM ANALYSIS
2.9 INVESTMENT AND FUNDING SCENARIO
2.10 TECHNOLOGY ANALYSIS
2.10.1 KEY TECHNOLOGIES
2.10.2 COMPLEMENTARY TECHNOLOGIES
2.10.3 ADJACENT TECHNOLOGIES
3.1 Introduction
3.2 Key Player Strategy/Right to Win, 2021-2025
3.2.1 Overview of Strategies Adopted By Players in Precipitated Silica
Market, 2021–2025
3.3 Revenue Analysis, 2021–2023
3.4 Market Share Analysis, 2023
3.4.1 Ranking of Key Market Players, 2023
3.5 Product Comparison
3.6 Company Valuation and Financial Metrics
3.6.1 Company Valuation
3.7 Company Evaluation Matrix: Key Players, 2023
3.7.1 Stars
3.7.2 Emerging Leaders
3.7.3 Pervasive Players
3.7.4 Participants
3.7.5 Company Footprint, Key Players, 2023
3.7.5.1 Company Footprint
3.7.5.2 Region Footprint
3.7.5.3 Grade Footprint
3.7.5.4 Application Footprint
3.7.5.5 End-use Industry Footprint
3.8 Company Evaluation Matrix: Startups/SMEs, 2023
3.8.1 Progressive Companies
3.8.2 Responsive Companies
3.8.3 Dynamic Companies
3.8.4 Starting Blocks
3.8.5 Competitive Benchmarking of Startup/SME Players, 2023
3.9 Competitive Scenario
3.9.1 Deals
3.9.2 Expansions
4.1 MULTISORB
4.1.1 Business overview
4.1.2 Products/Solutions/Services offered
4.1.3 Recent developments
4.2 SUNSHINE INDUSTRIES
4.2.1 Business overview
4.2.2 Products/Solutions/Services offered
4.2.3 Recent developments
4.3 JINSHA PRECIPITATED SILICA MANUFACTURING CO., LTD.
4.3.1 Business overview
4.3.2 Products/Solutions/Services offered
4.3.3 Recent developments
4.4 HISILCO
4.4.1 Business overview
4.4.2 Products/Solutions/Services offered
4.4.3 Recent developments
4.5 REGOJ CHEMICAL INDUSTRIES
4.5.1 Business overview
4.5.2 Products/Solutions/Services offered
4.5.3 Recent developments
4.6 TRIVENI CHEMICALS
4.6.1 Business overview
4.6.2 Products/Solutions/Services offered
4.6.3 Recent developments
4.7 DURGA CHEMICAL INDUSTRIES
4.7.1 Business overview
4.7.2 Products/Solutions/Services offered
4.7.3 Recent developments
4.8 KADVANI CHEMICALS PVT. LTD.
4.8.1 Business overview
4.8.2 Products/Solutions/Services offered
4.8.3 Recent developments


