Comparing 5 vendors in Electronic Lab Notebook Startups across 0 criteria.
The Electronic Lab Notebook (ELN) market is growing as research organizations across various industries seek to enhance data management, streamline workflows, and ensure regulatory compliance. ELNs are replacing traditional paper notebooks, offering a secure and collaborative platform for recording experimental data, managing lab processes, and protecting intellectual property. The adoption of cloud-based ELNs is on the rise, providing benefits like remote access, scalability, and reduced IT overhead. These platforms are crucial for industries like pharmaceuticals, life sciences, and chemicals, where data integrity and traceability are paramount.
1.1 Study Objectives
1.2 Market Definition
1.3 Study Scope
1.3.1 Markets Covered and Regional Scope
1.3.2 Inclusions and Exclusions
1.3.3 Years Considered
1.4 Currency Considered
1.5 Unit Considered
1.6 Limitations
1.7 Stakeholders
2.1 Introduction
2.2 Market Dynamics
2.2.1 Drivers
2.2.1.1 Increasing focus on digitization in laboratories
2.2.1.2 Advantages of electronic lab notebooks over conventional notebooks
2.2.1.3 Growing R&D expenditure of pharmaceutical & biotechnology companies
2.2.1.4 Technological advancements
2.2.1.5 Need for data integrity & compliance
2.2.2 Restraints
2.2.2.1 High initial installation cost of electronic lab notebooks
2.2.2.2 Data security & privacy concerns
2.2.3 Opportunities
2.2.3.1 Growing adoption in emerging markets
2.2.3.2 Rising popularity of cloud-based solutions
2.2.3.3 Integration of artificial intelligence and machine learning
2.2.4 Challenges
2.2.4.1 Integration with existing systems
2.2.4.2 Dearth of trained professionals
2.3 Trends/Disruptions Impacting Customer Business
2.4 Value Chain Analysis
2.5 Ecosystem Analysis
2.6 Investment and Funding Scenario
2.7 Technology Analysis
2.7.1 Key Technologies
2.7.2 Complementary Technologies
2.7.3 Adjacent Technologies
2.8 Patent Analysis
2.9 Trade Analysis
2.10 Porter’s Five Forces Analysis
2.10.1 Threat of New Entrants
2.10.2 Threat of Substitutes
2.10.3 Bargaining Power of Suppliers
2.10.4 Bargaining Power of Buyers
2.10.5 Intensity of Competitive Rivalry
3.1 Introduction
3.2 Key Player Strategies/Right to Win
3.3 Revenue Analysis
3.4 Market Share Analysis
3.5 Company Valuation and Financial Metrics
3.6 Brand/Product Comparison
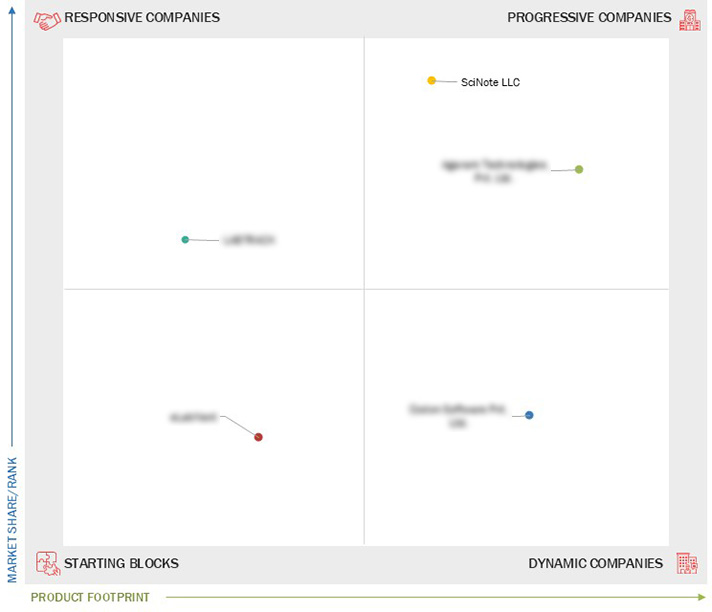
3.7 Company Evaluation Matrix: Startups/SMEs
3.7.1 Progressive Companies
3.7.2 Responsive Companies
3.7.3 Dynamic Companies
3.7.4 Starting Blocks
3.7.5 Competitive Benchmarking: Startups/SMEs
3.7.5.1 Detailed list of key startups/SMEs
3.7.5.2 Competitive benchmarking of key startups/SMEs
3.8 Competitive Scenario
3.8.1 Product Launches
3.8.2 Deals
3.8.3 Others
4.1 SciNote LLC
4.1.1 Business overview
4.1.2 Products/Solutions/Services offered
4.1.3 Recent developments
4.2 Agaram Technologies Pvt. Ltd.
4.2.1 Business overview
4.2.2 Products/Solutions/Services offered
4.2.3 Recent developments
4.3 LABTRACK
4.3.1 Business overview
4.3.2 Products/Solutions/Services offered
4.3.3 Recent developments
4.4 Codon Software Pvt. Ltd.
4.4.1 Business overview
4.4.2 Products/Solutions/Services offered
4.4.3 Recent developments
4.5 eLabNext
4.5.1 Business overview
4.5.2 Products/Solutions/Services offered
4.5.3 Recent developments
Company Profiles
Strategy, financials, growth, and SWOTMarket Insights
Visual quadrant of competitors and leadersBenchmarking
Compare by product, region, and end-userLead Gen Add-on
Use the quadrant to attract clients ![]()
360 Quadrants is a scientific research methodology by MarketsandMarkets to understand market leaders in 6000+ micro markets
360 Quadrants is a scientific research methodology by MarketsandMarkets to understand market leaders in 6000+ micro markets
Email : [email protected]
Quick Links ![]()
360 Quadrants is a scientific research methodology by MarketsandMarkets to understand market leaders in 6000+ micro markets