Comparing 12 vendors in Computer Aided Engineering Startups across 0 criteria.
The Computer-Aided Engineering (CAE) market is evolving rapidly, driven by startups and SMEs offering innovative simulation tools across industries. Companies are categorized into progressive, responsive, and dynamic groups based on their product portfolios and market strategies. Progressive firms focus on customized solutions and growth initiatives, responsive ones emphasize strategic expansion and deployment, while dynamic players leverage strong distribution networks and innovation. This segmentation highlights the diverse approaches shaping the CAE landscape and the competitive momentum among emerging tech providers.
1.1 Study Objectives
1.2 Market Definition
1.2.1 Inclusions and Exclusions
1.3 Study Scope
1.3.1 Market Segmentation
1.3.2 Years Considered
1.3.3 Currency Considered
1.4 Stakeholders
2.1 Introduction
2.2 Market Dynamics
2.2.1 Drivers
2.2.1.1 Increasing implementation of advanced simulation techniques
2.2.1.2 Growing Use in EVs and autonomous vehicles
2.2.1.3 Rising adoption of IoT and 3D printing
2.2.2 Restraints
2.2.2.1 High initial setup costs
2.2.2.2 Data security concerns with cloud‑based CAE
2.2.3 Opportunities
2.2.3.1 AI‑powered simulation and generative design
2.2.3.2 Integration with digital twin and Industry 4.0
2.2.4 Challenges
2.2.4.1 Complexity of multiphysics simulations
2.2.4.2 Interoperability issues across platforms
2.2.4.3 Shortage of skilled simulation professional
2.3 Impact of Generative AI on Computer-aided Engineering Market
2.3.1 Generative AI
2.3.2 Top Use Cases and Market Potential in CAE Market
2.3.3 Impact of Generative AI on Interconnected and Adjacent Ecosystems
2.3.3.1 Computer-aided design (CAD)
2.3.3.2 Product lifecycle management (PLM)
2.3.3.3 High-performance computing (HPC) & cloud computing
2.3.3.4 Additive manufacturing (3D printing)
2.3.3.5 Digital twin and industrial IoT (IIoT)
2.4 Technology Analysis
2.4.1 Key Technologies
2.4.2 Adjacent Technologies
2.4.3 Complementary Technologies
2.5 Trends/Disruptions Impacting Customer Business
2.6 Evolution of Computer-aided Engineering
2.6.1 Introduction
2.6.2 Early Days of CAE Tools
2.6.3 Evolution and Advancement in CAE Tools
2.6.4 Modern CAE Solutions and Their Impact
2.6.5 Conclusion
2.7 Value Chain Analysis
2.8 Ecosystem Analysis
2.9 Porter’s Five Forces Analysis
2.9.1 Threat of New Entrants
2.9.2 Bargaining Power of Suppliers
2.9.3 Bargaining Power of Buyers
2.9.4 Threat of Substitutes
2.9.5 Intensity of Competitive Rivalry
2.10 Patent Analysis
2.11 Key Conferences and Events, 2025
2.12 Investment and Funding Scenario
2.13 Impact of US Tariff – Computer-aided Engineering Market
2.13.1 Introduction
2.13.2 Key Tariff Rates
2.13.3 Price Impact Analysis
2.13.4 Impact on Country/Region
2.13.4.1 North America
2.13.4.1.1 US
2.13.4.1.2 Canada
2.13.4.1.3 Mexico
2.13.4.2 Europe
2.13.4.2.1 Germany
2.13.4.2.2 France
2.13.4.2.3 UK
2.13.4.3 Asia Pacific
2.13.4.3.1 China
2.13.4.3.2 India
2.13.4.3.3 Japan
2.13.5 Impact on End-Use Industries
3.1 Key Player Strategies/Right to Win, 2022–2024
3.2 Revenue Analysis, 2020–2024
3.3 Market Share Analysis, 2024
3.4 Brand Comparison
3.5 Company Valuation and Financial Metrics
3.5.1 Company Valuation
3.5.2 Financial Metrics
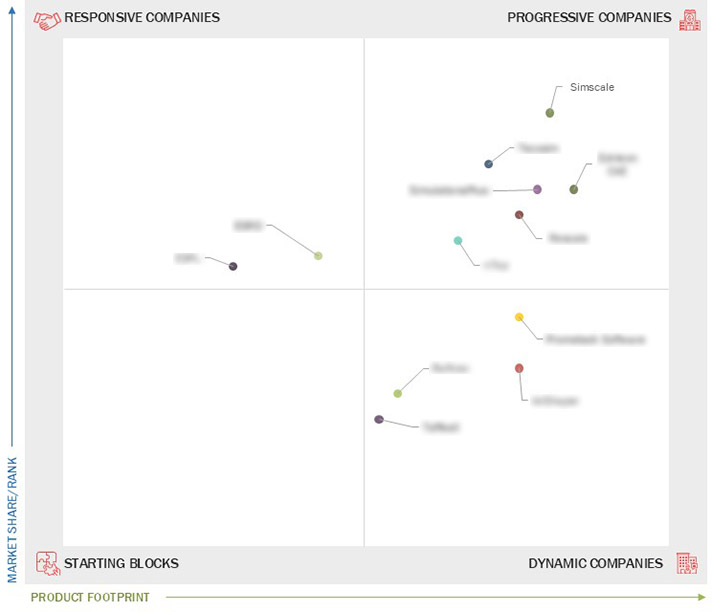
3.6 Company Evaluation Matrix: Startups/SMEs, 2024
3.6.1 Progressive Companies
3.6.2 Responsive Companies
3.6.3 Dynamic Companies
3.6.4 Starting Blocks
3.6.5 Competitive Benchmarking: Startups/SMEs, 2024
3.6.5.1 Detailed list of key startups/SMEs
3.6.5.2 Competitive benchmarking of key startups
3.7 Competitive Scenario
3.7.1 Product Launches/Enhancements
3.7.2 Deals
4.1 SIMSCALE
4.1.1 Business overview
4.1.2 Products/Solutions/Services offered
4.1.3 Recent developments
4.2 TECOSIM
4.2.1 Business overview
4.2.2 Products/Solutions/Services offered
4.2.3 Recent developments
4.3 PROMETECH SOFTWARE
4.3.1 Business overview
4.3.2 Products/Solutions/Services offered
4.3.3 Recent developments
4.4 ECHLEON CAE
4.4.1 Business overview
4.4.2 Products/Solutions/Services offered
4.4.3 Recent developments
4.5 ESPL
4.5.1 Business overview
4.5.2 Products/Solutions/Services offered
4.5.3 Recent developments
4.6 RESCALE
4.6.1 Business overview
4.6.2 Products/Solutions/Services offered
4.6.3 Recent developments
4.7 ESRD
4.7.1 Business overview
4.7.2 Products/Solutions/Services offered
4.7.3 Recent developments
4.8 NTOPOLOGY
4.8.1 Business overview
4.8.2 Products/Solutions/Services offered
4.8.3 Recent developments
4.9 SIMULATIONSPLUS
4.9.1 Business overview
4.9.2 Products/Solutions/Services offered
4.9.3 Recent developments
4.10 RAFINEX
4.10.1 Business overview
4.10.2 Products/Solutions/Services offered
4.10.3 Recent developments
4.11 AIRSHAPER
4.11.1 Business overview
4.11.2 Products/Solutions/Services offered
4.11.3 Recent developments
4.12 TOFFEEX
4.12.1 Business overview
4.12.2 Products/Solutions/Services offered
4.12.3 Recent developments
Company Profiles
Strategy, financials, growth, and SWOTMarket Insights
Visual quadrant of competitors and leadersBenchmarking
Compare by product, region, and end-userLead Gen Add-on
Use the quadrant to attract clients develop3d
 Jan 2026
Digital Engineering 24/7
Jun 2025
Digital Engineering 24/7
May 2025
3D Printing Industry
May 2025
develop3d
Apr 2025
3d adept media
Feb 2025
Metal Additive Manufacturing magazine
Feb 2025
3DPrint.com
Feb 2025
Jan 2026
Digital Engineering 24/7
Jun 2025
Digital Engineering 24/7
May 2025
3D Printing Industry
May 2025
develop3d
Apr 2025
3d adept media
Feb 2025
Metal Additive Manufacturing magazine
Feb 2025
3DPrint.com
Feb 2025
![]()
360 Quadrants is a scientific research methodology by MarketsandMarkets to understand market leaders in 6000+ micro markets
360 Quadrants is a scientific research methodology by MarketsandMarkets to understand market leaders in 6000+ micro markets
Email : [email protected]
Quick Links ![]()
360 Quadrants is a scientific research methodology by MarketsandMarkets to understand market leaders in 6000+ micro markets