Comparing 14 vendors in Knowledge Graph Startups across 0 criteria.
A knowledge graph is a structured representation of real-world entities and the relationships between them. It effectively captures the context and meaning of data by connecting objects, events, situations, or concepts through well-defined relationships. This interconnected structure enables deeper understanding and reasoning across various domains. The growing demand for artificial intelligence (AI) and generative AI technologies is a key driver of the knowledge graph market. As organizations seek to harness data for strategic advantage, they are increasingly adopting advanced AI tools to enhance decision-making and boost operational efficiency. In this landscape, knowledge graphs play a pivotal role by providing a robust foundation of structured knowledge that AI systems can leverage.
Additionally, the acceleration of digital transformation—fueled in part by the global pandemic—has pushed organizations to embrace adaptive AI technologies to meet evolving customer expectations and market demands. The synergy between knowledge graphs and generative AI is poised to drive substantial market growth, as more businesses recognize their potential to enhance customer experiences and operational performance.
1.1 Study objectives
1.2 Market Definition
1.3 Market Scope
1.3.1 Market Segmentation and Regional Scope
1.3.2 Inclusions and Exclusions
1.3.3 Years Considered
1.3.4 Currency Considered
1.3.5 Units Considered
1.4 Stakeholders
2.1 INTRODUCTION
2.2 MARKET DYNAMICS
2.3 DRIVERS
2.3.1 Rising demand for AI/generative AI solutions
2.3.2 Rapid growth in data volume and complexity
2.3.3 Growing demand for semantic search
2.4 RESTRAINTS
2.4.1 Data quality and integration challenges
2.4.2 Navigation of saturated data management tool landscape
2.4.3 Scalability issues
2.5 OPPORTUNITIES
2.5.1 Leveraging LLMs to reduce knowledge graph construction costs
2.5.2 Data unification and rapid proliferation of knowledge graphs
2.5.3 Increasing adoption in healthcare and life sciences to
revolutionize data management and enhance patient outcomes
2.6 CHALLENGES
2.6.1 Lack of expertise and awareness
2.6.2 Standardization and interoperability
2.6.3 Difficulty in demonstrating full value of knowledge graphs through
single use cases
2.7 VALUE CHAIN ANALYSIS
2.8 ECOSYSTEM ANALYSIS
2.9 INVESTMENT AND FUNDING SCENARIO
2.10 TECHNOLOGY ANALYSIS
2.10.1 KEY TECHNOLOGIES
2.10.2 COMPLEMENTARY TECHNOLOGIES
2.10.3 ADJACENT TECHNOLOGIES
3.1 Overview
3.2 Key Player Strategies/Right to Win, 2020–2024
3.3 Market Share Analysis, 2024
3.4 Revenue Analysis, 2019–2023
3.5 Company Valuation and Financial Metrics, 2024
3.6 Brand Comparison
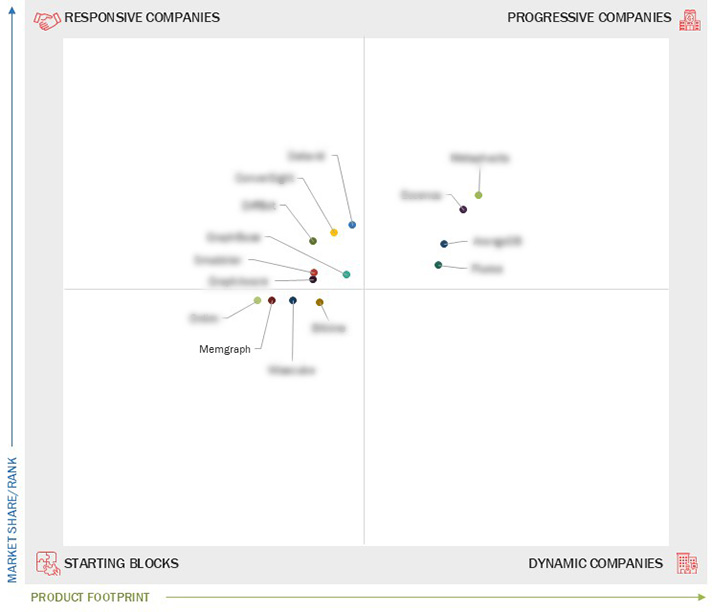
3.7 Company Evaluation Matrix: Key Players, 2024
3.7.1 Stars
3.7.2 Emerging Leaders
3.7.3 Pervasive Players
3.7.4 Participants
3.8 Company Footprint: Key Players, 2024
3.8.1 Company Footprint
3.8.2 Region Footprint
3.8.3 Product type footprint
3.8.4 Customer interaction channel footprint
3.8.5 End User Footprint
3.9 Competitive Scenario
3.9.1 Product Launches & Enhancements
3.9.2 Deals
4.1 Metaphacts
4.1.1 Business overview
4.1.2 Products/Solutions/Services offered
4.1.3 Recent developments
4.2 Eccenca
4.2.1 Business overview
4.2.2 Products/Solutions/Services offered
4.2.3 Recent developments
4.3 ArangoDB
4.3.1 Business overview
4.3.2 Products/Solutions/Services offered
4.3.3 Recent developments
4.4 Fluree
4.4.1 Business overview
4.4.2 Products/Solutions/Services offered
4.4.3 Recent developments
4.5 Datavid
4.5.1 Business overview
4.5.2 Products/Solutions/Services offered
4.5.3 Recent developments
4.6 ConverSight
4.6.1 Business overview
4.6.2 Products/Solutions/Services offered
4.6.3 Recent developments
4.7 DiffBot
4.7.1 Business overview
4.7.2 Products/Solutions/Services offered
4.7.3 Recent developments
4.8 Graphbase
4.8.1 Business overview
4.8.2 Products/Solutions/Services offered
4.8.3 Recent developments
4.9 Memgraph
4.9.1 Business overview
4.9.2 Products/Solutions/Services offered
4.9.3 Recent developments
4.10 Smabbler
4.10.1 Business overview
4.10.2 Products/Solutions/Services offered
4.10.3 Recent developments
4.11 GraphAware
4.11.1 Business overview
4.11.2 Products/Solutions/Services offered
4.11.3 Recent developments
4.12 Wisecube
4.12.1 Business overview
4.12.2 Products/Solutions/Services offered
4.12.3 Recent developments
4.13 Bitnine
4.13.1 Business overview
4.13.2 Products/Solutions/Services offered
4.13.3 Recent developments
4.14 Onlim
4.14.1 Business overview
4.14.2 Products/Solutions/Services offered
4.14.3 Recent developments
Company Profiles
Strategy, financials, growth, and SWOTMarket Insights
Visual quadrant of competitors and leadersBenchmarking
Compare by product, region, and end-userLead Gen Add-on
Use the quadrant to attract clients Blockchain News
 Sep 2024
AiThority
Dec 2023
businesswire
Jan 2023
Sep 2024
AiThority
Dec 2023
businesswire
Jan 2023
![]()
360 Quadrants is a scientific research methodology by MarketsandMarkets to understand market leaders in 6000+ micro markets
360 Quadrants is a scientific research methodology by MarketsandMarkets to understand market leaders in 6000+ micro markets
Email : [email protected]
Quick Links ![]()
360 Quadrants is a scientific research methodology by MarketsandMarkets to understand market leaders in 6000+ micro markets