
Electric Ships Quadrant Report
Electric Ships Market (Global) Company Evaluation Quadrant
Published on
Oct'2019
Pages
83
Code
360-AS 7444
An electric ship is a vessel, which is propelled by an electric propulsion and the power is supplied wholly by a battery system while a hybrid ship is a vessel, which has a battery system to run the ship and also has diesel generators to back up the battery system during high power requirements, or when the batteries are drained out. The electric ships market report covers the electrification of existing ships under the retrofit segment. The demand for new ships with hybrid propulsion is covered under the line fit segment, and the demand for fully electric ships with electric propulsion is covered under the newbuild segment.
The global electric ships market size is projected to grow to USD 15 billion by 2030. The market is witnessing growth owing to the stringent IMO regulation, rise in waterborne trade, and the development of lithium-ion batteries. However, long downtown during retrofitting ships, and limited range and capacity of fully electric ships restrain the market growth.
Increasing demand to reduce sulfur emissions & adoption of electric vessels to drive growth in Electric Ships Market
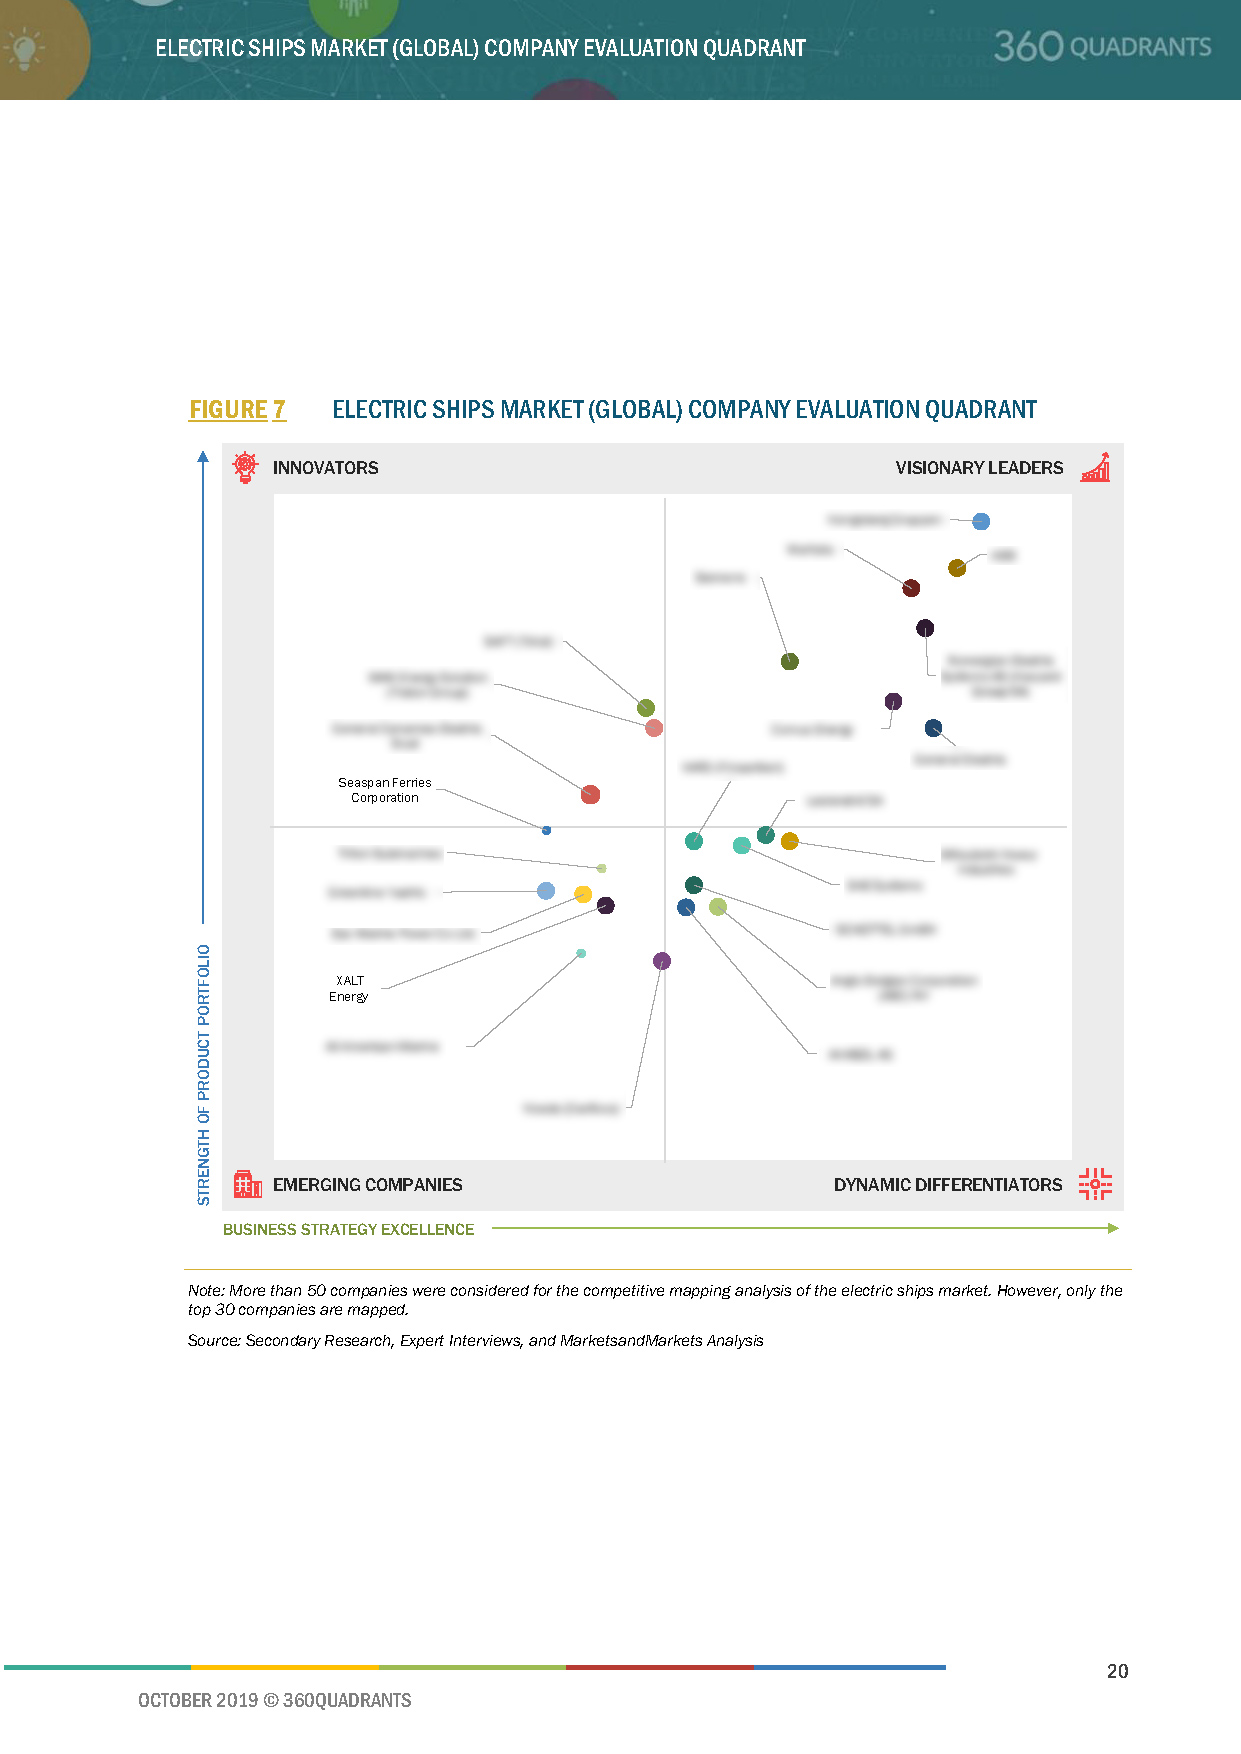
This report identifies and benchmarks the best Electric Ship manufacturers such as Kongsberg (Norway), ABB (Switzerland), Wartsila (Finland), Norwegian Electric Systems AS (Norway), Corvus Energy (Canada), and evaluates them on the basis of business strategy excellence and strength of product portfolio within the Electric Ships ecosystem, combining inputs from various industry experts, buyers, and vendors, and extensive secondary research including annual reports, company press releases, investor presentations, free and paid company databases. They are rated and positioned on 2x2 matrix, called as ‘Company Evaluation Quadrant’, and identified as Visionary Leaders (top companies), Dynamic Differentiators, Innovators, or Emerging companies.
The report includes market specific company profiles of all 20 top electric ship companies and assesses the recent developments that shape the competitive landscape of this highly fragmented market.
List of companies evaluated and profiled in the report:
- ABB
- WARTSILA
- KONGSBERG GRUPPEN
- GENERAL ELECTRIC (GE)
- VARD
- SIEMENS
- LECLANCHÉ SA
- BAE SYSTEMS
- NORWEGIAN ELECTRIC SYSTEMS
- MAN ENERGY SOLUTIONS SE
- CORVUS ENERGY
- ECHANDIA MARINE AB
- GENERAL DYNAMICS ELECTRIC BOAT
- ANGLO BELGIAN CORPORATION (ABC) NV
- SCHOTTEL GMBH
- VISEDO
- ECO MARINE POWER CO LTD.
- AKASOL AG
- EST FLOATTECH
- SAFT (TOTAL)
Table of Contents
1 Introduction
1.1 Market Definition
2 Market Overview
2.1 Introduction
2.2 Market Dynamics
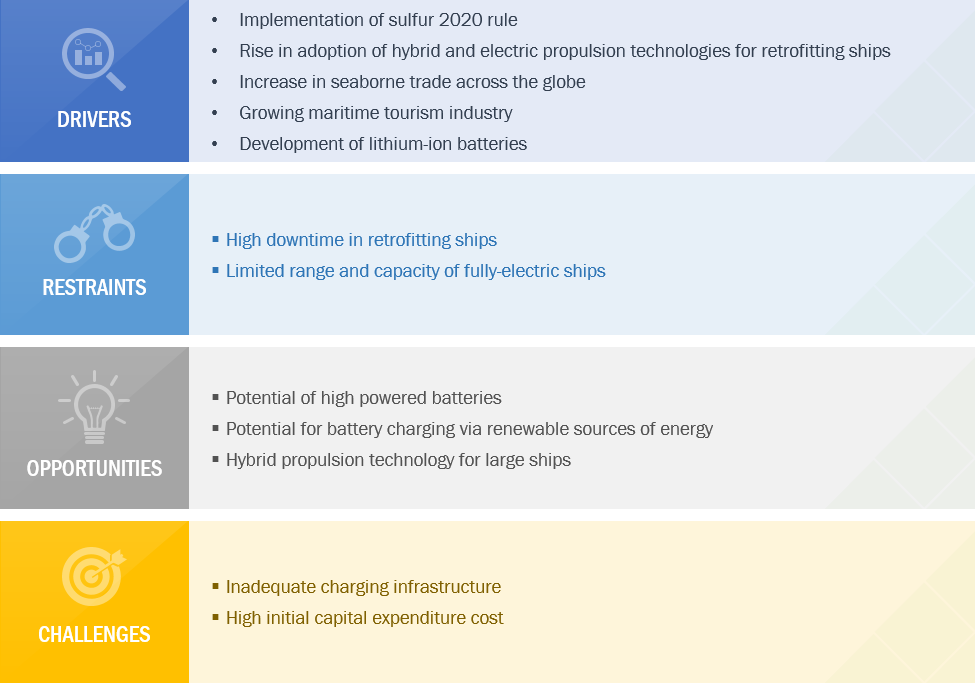
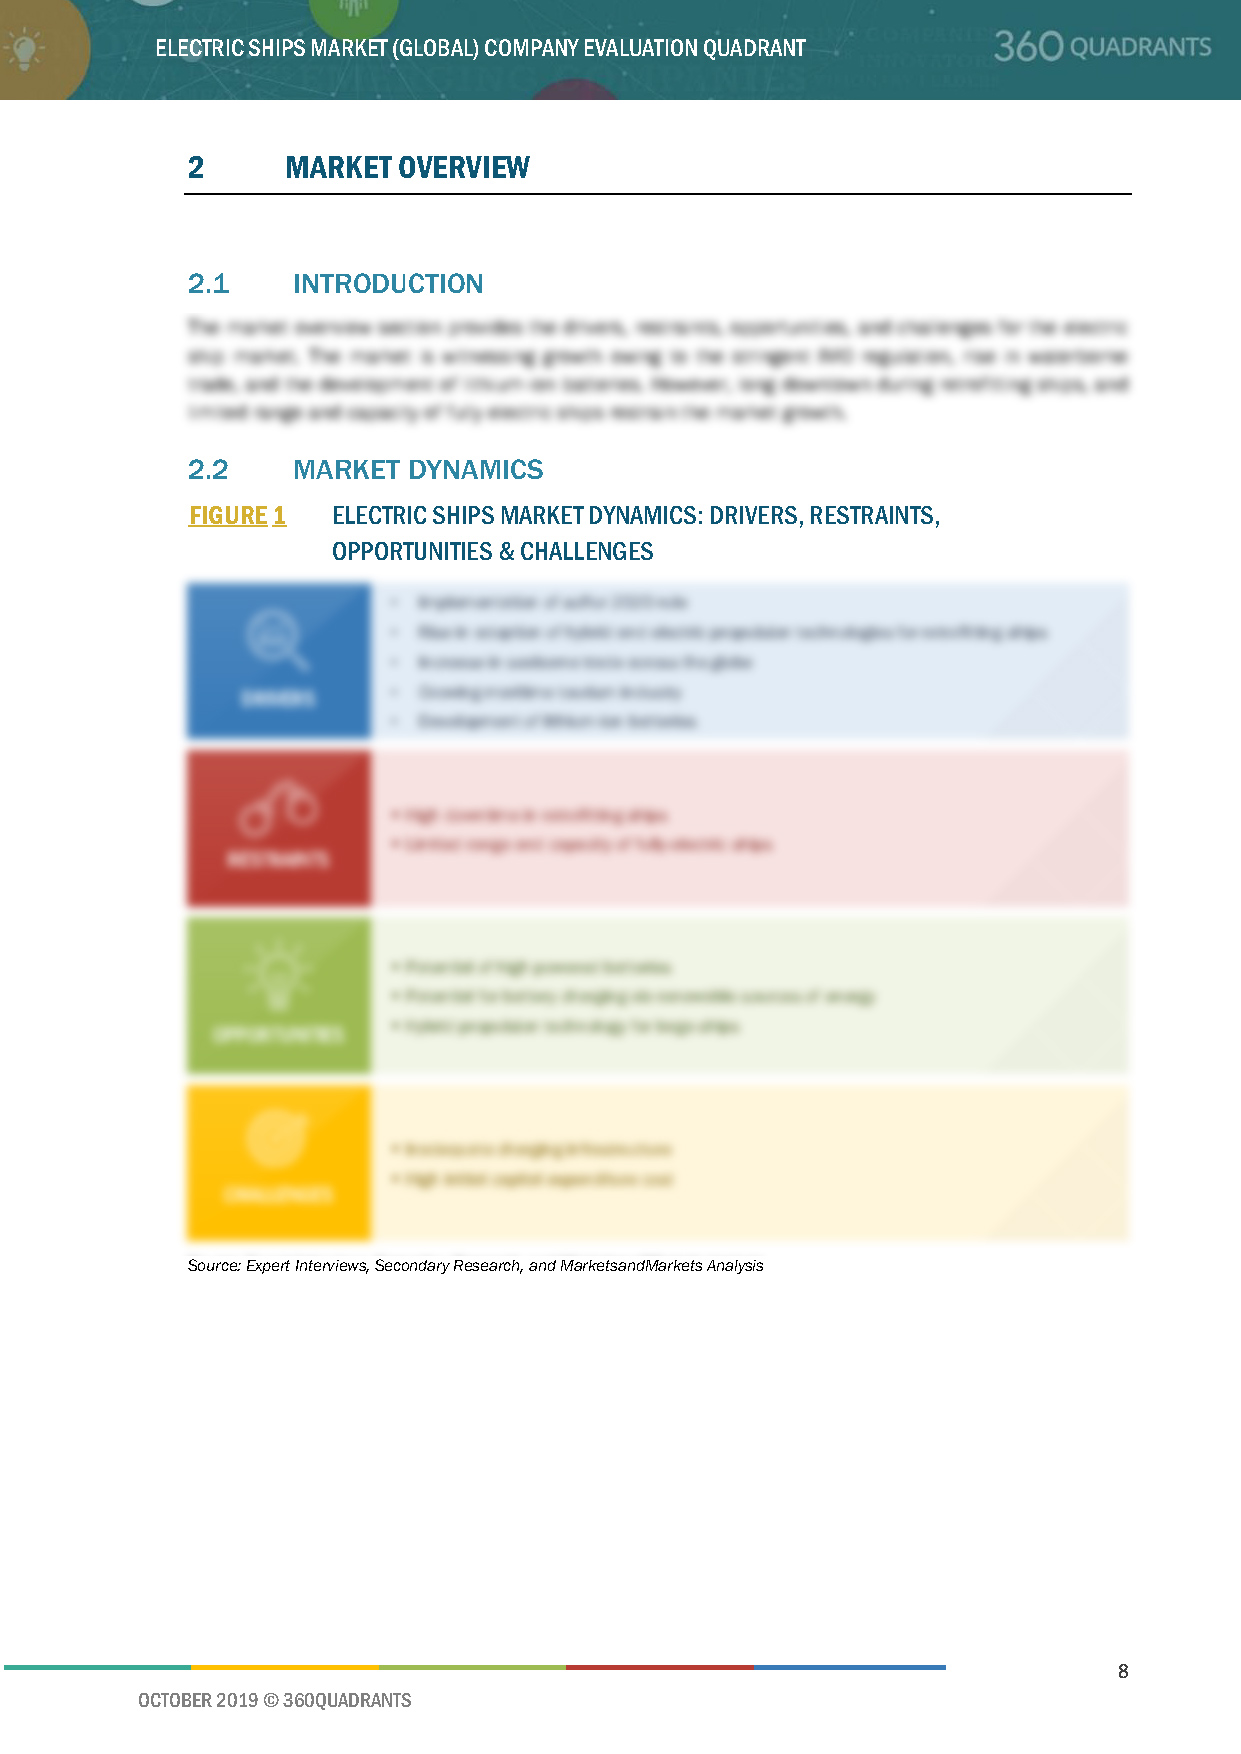
Figure 1 Electric Ships Market Dynamics: Drivers, Restraints, Opportunities & Challenges
2.2.1 Drivers
2.2.1.1 Implementation of Sulfur 2020 Rule
Table 1 Sulfur Content Regulations in Bunker Fuel
2.2.1.2 Rise in Adoption of Hybrid and Electric Propulsion Technologies for Retrofitting Ships
2.2.1.3 Increase in Seaborne Trade Across the Globe
Figure 2 Global Seaborne Trade, By Quantity Traded, 2005–2017
2.2.1.4 Growing Maritime Tourism Industry
Figure 3 Increase in Number of Cruise Passengers in Europe, 2007—2016
Figure 4 Global Cruise Industry Share, By Region, 2016
2.2.1.5 Development of Lithium-Ion Batteries
Figure 5 Most Common Lithium-Ion Batteries With Key Features
Table 2 Current Battery Capacity and Requirements of Ships
2.2.2 Restraints
2.2.2.1 High Downtime in Retrofitting Ships
2.2.2.2 Limited Range and Capacity of Fully-Electric Ships
2.2.3 Opportunities
2.2.3.1 Potential of High Powered Batteries
Figure 6 Relative Feasibility of Different Energy-Storage Technologies
2.2.3.2 Potential for Battery Charging Via Renewable Sources of Energy
2.2.3.3 Hybrid Propulsion Technology for Large Ships
2.2.4 Challenges
2.2.4.1 Inadequate Charging Infrastructure
2.2.4.2 High Initial Capital Expenditure Cost
Table 3 Capital Expenditure, Savings, and Payback
Table 4 Capital Expenditure, Savings, and Payback
Table 5 Capital Expenditure, Savings, and Payback
2.3 Key Autonomous Ships Development Projects
2.3.1 Rolls-Royce Marine – 2020
2.3.2 Kongsberg and Yara – 2020
2.3.3 Japanese Consortium – 2025
2.4 Innovations & Patent Registrations
Table 6 Innovations & Patent Registrations, 2011–2017
3 Company Evaluation Quadrant
3.1 Visionary Leaders
3.2 Innovators
3.3 Dynamic Differentiators
3.4 Emerging Companies
Figure 7 Electric Ships Market (Global) Company Evaluation Quadrant
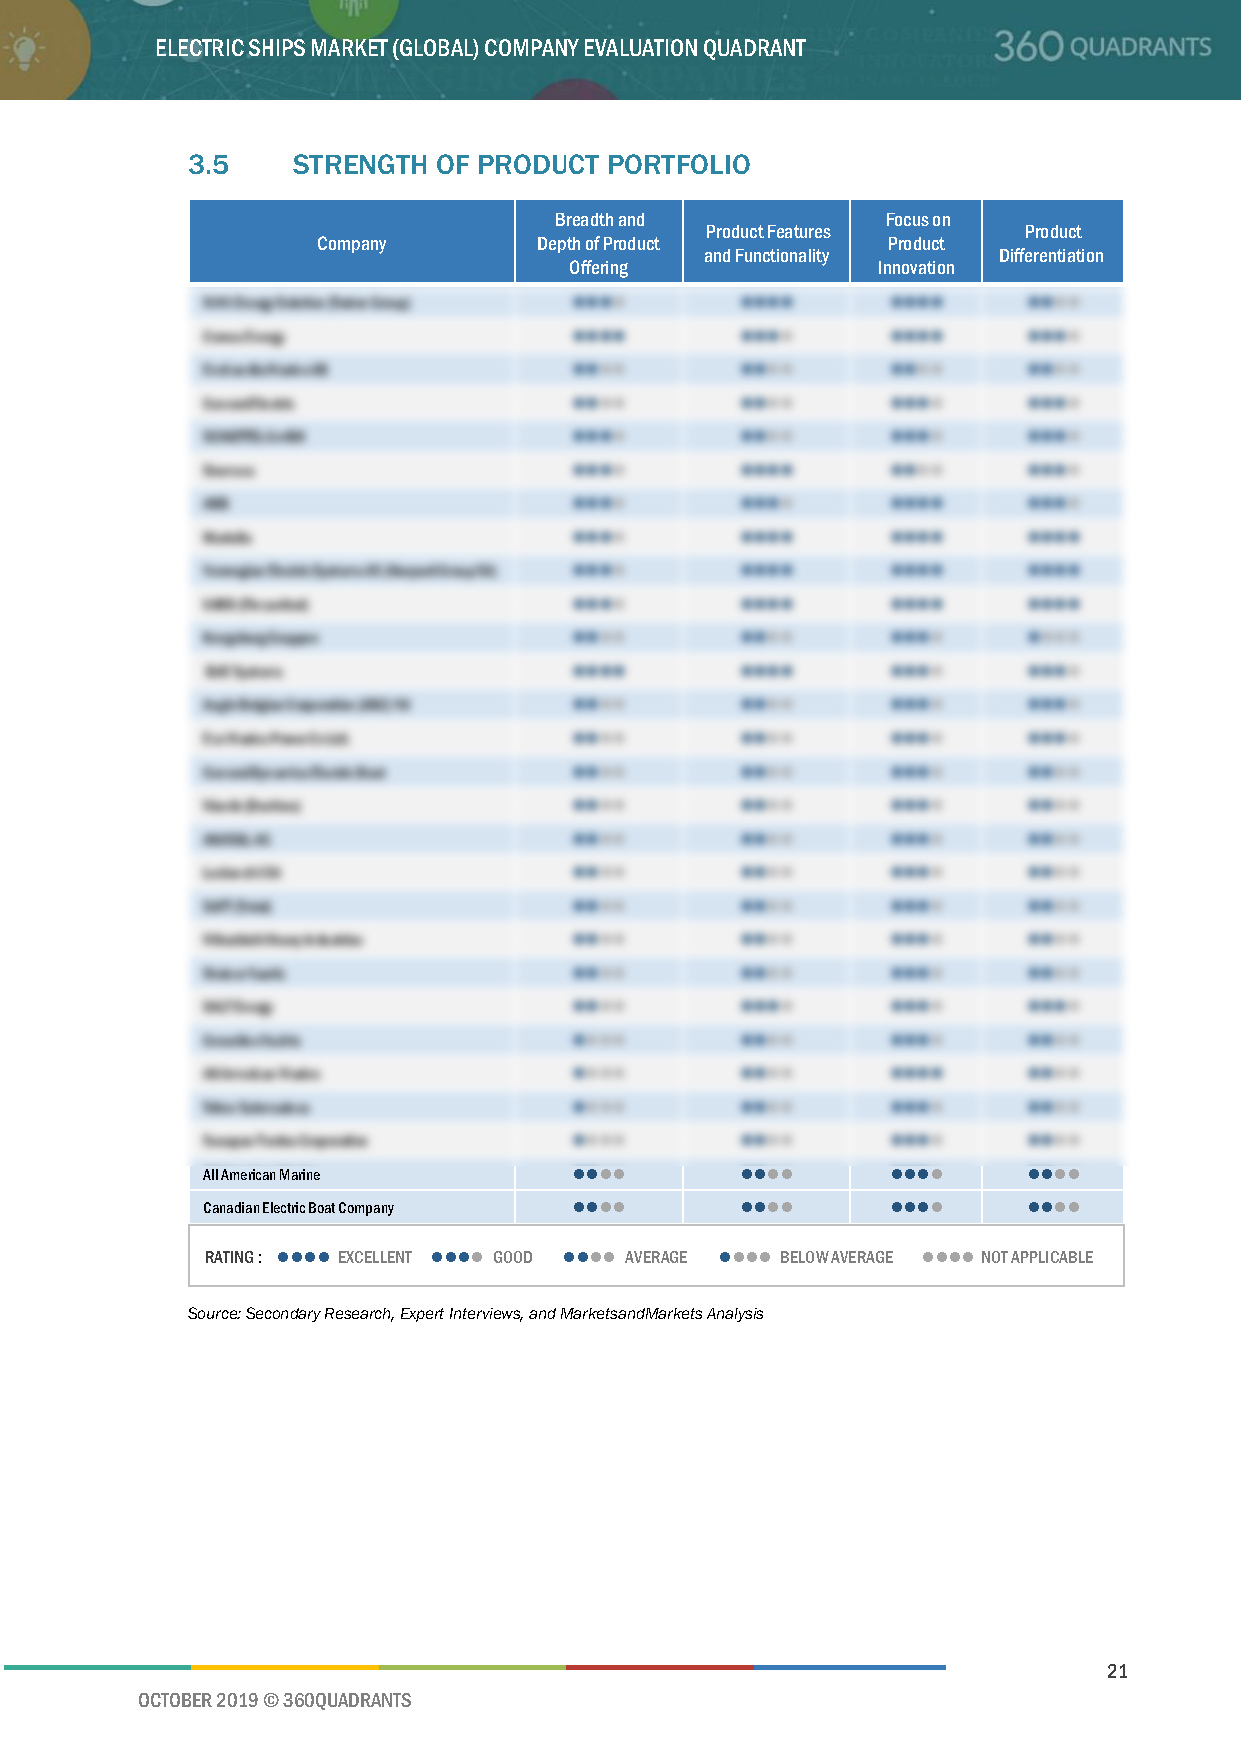
3.5 Strength of Product Portfolio
3.6 Business Strategy Excellence
4 Competitive Landscape
4.1 Introduction
4.2 Major Players, 2018
Figure 8 Major Players in Electric Ships Market, 2018
4.3 Competitive Scenario
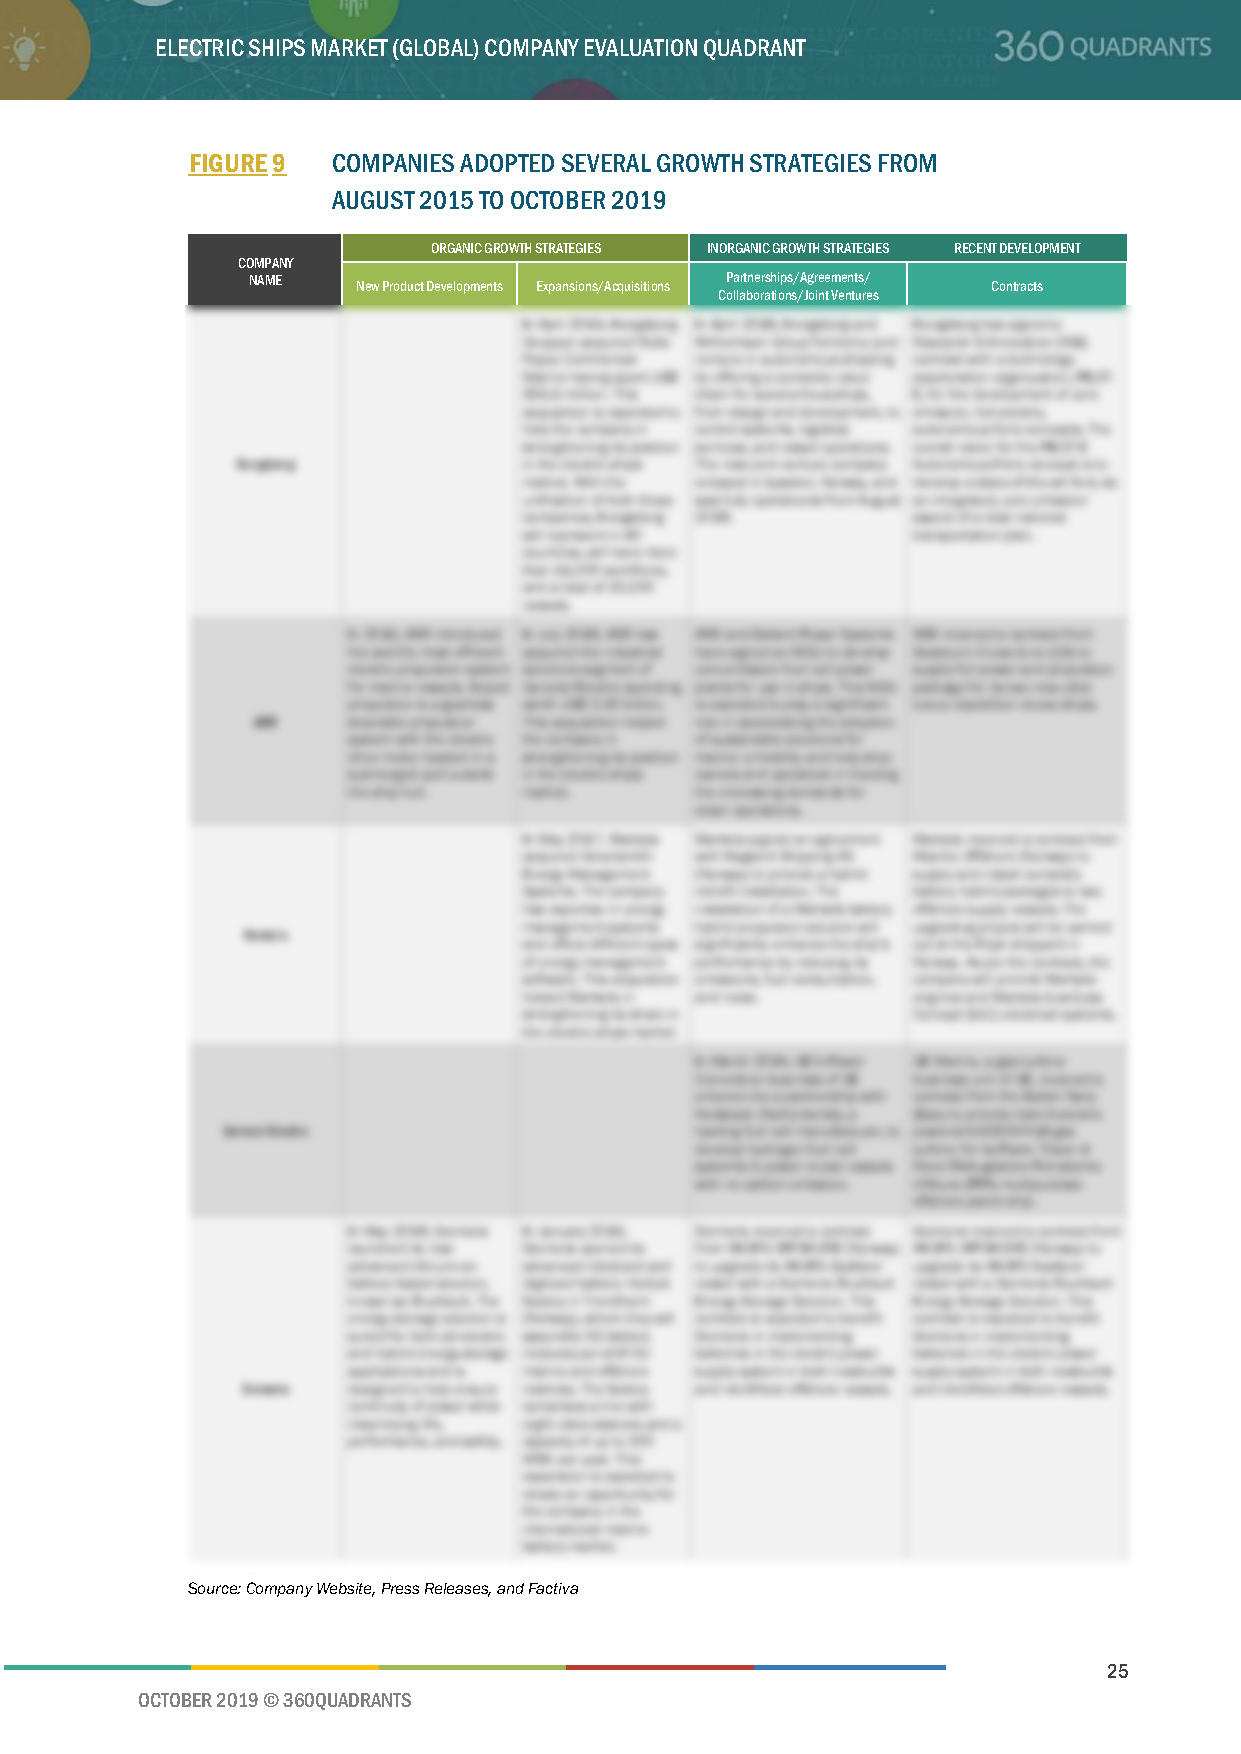
Figure 9 Companies Adopted Several Growth Strategies From
August 2015 to October 2019
4.4 Competitive Scenario
4.4.1 New Product Launches
Table 7 New Product Launches, August 2015– May 2019
4.4.2 Contracts
Table 8 Contracts, 2015 - 2019
4.4.3 Expansions & Acquisitions
Table 9 Expansions and Acquisitions, 2015–2019
4.4.4 Partnerships, Agreements, Joint Ventures, and Collaborations
Table 10 Partnerships, Agreements, Joint Ventures, and Collaborations, 2015 –2019
5 Company Profiles
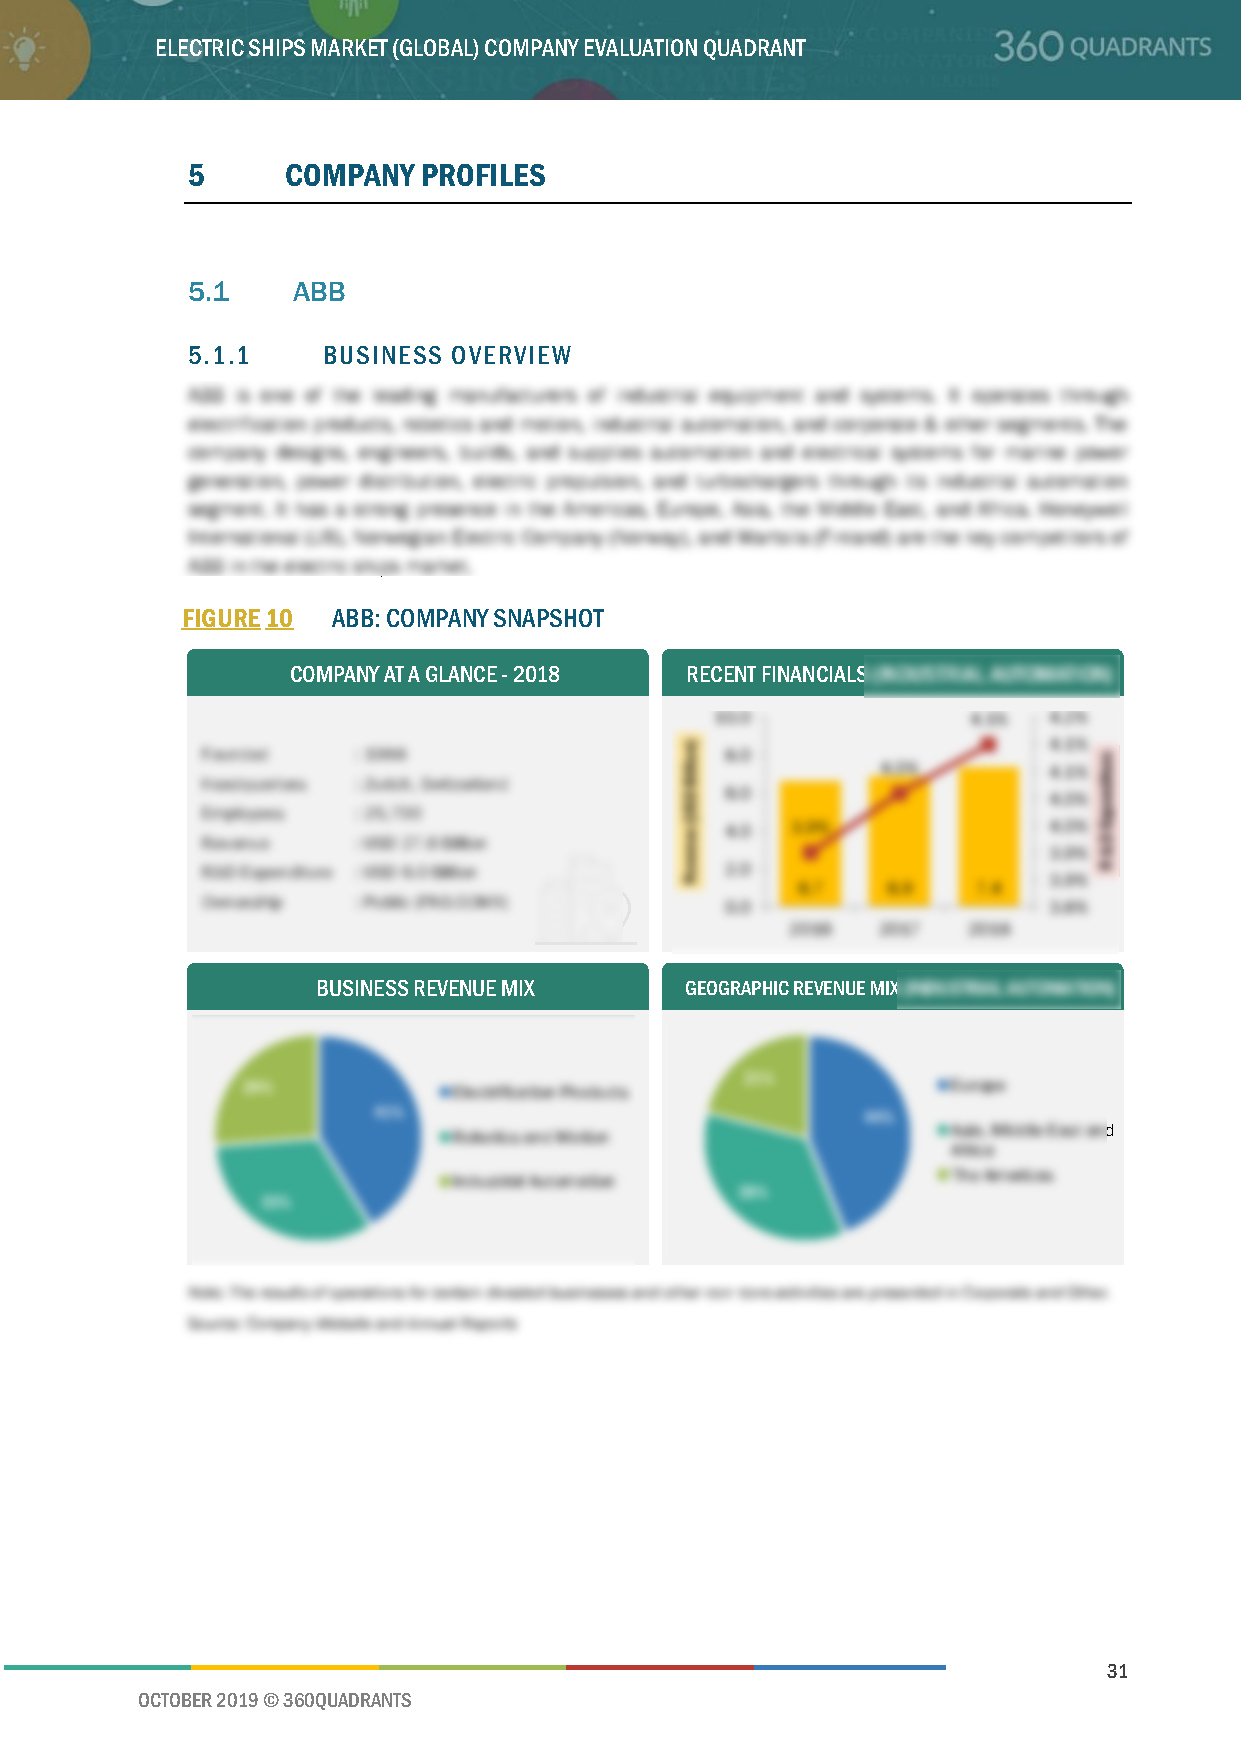
5.1 ABB
5.1.1 Business Overview*
Figure 10 ABB: Company Snapshot
5.1.2 Products/Solutions/Services Offered*
5.1.3 Customers and Application Areas
5.1.4 Unique Value Proposition and Right to Win
5.1.5 ABB’s Right to Win (Company Business Snapshot)
5.1.6 Growth Strategy
5.1.7 SWOT Analysis*
Table 11 ABB: SWOT Analysis
5.1.8 MnM View*
(*Above sections are present for all of below companies)
5.2 Wartsila
Figure 11 Wartsila: Company Snapshot
Table 12 Wartsila: SWOT Analysis
5.3 Kongsberg Gruppen
Figure 12 Kongsberg Gruppen: Company Snapshot
Table 13 Kongsberg: SWOT Analysis
5.4 General Electric (GE)
Figure 13 General Electric: Company Snapshot
Table 14 GE: SWOT Analysis
5.5 Vard
Figure 14 Vard: Company Snapshot
5.6 Siemens
Figure 15 Siemens: Company Snapshot
Table 15 Siemens: SWOT Analysis
5.7 Leclanché SA
Figure 16 Leclanche SA: Company Snapshot
5.8 BAE Systems
Figure 17 BAE Systems: Company Snapshot
5.9 Norwegian Electric Systems
5.10 MAN Energy Solutions SE
5.11 Corvus Energy
5.12 Echandia Marine AB
5.13 General Dynamics Electric Boat
5.14 Anglo Belgian Corporation (ABC) NV
5.15 SCHOTTEL Gmbh
5.16 Visedo
5.17 ECO Marine Power Co Ltd.
5.18 Akasol AG
5.19 EST Floattech
5.20 Saft (Total)
Figure 18 Saft: Company Snapshot
6 Appendix
6.1 Methodology
This report identifies and benchmarks the best Electric Ship manufacturers such as Kongsberg (Norway), ABB (Switzerland), Wartsila (Finland), Norwegian Electric Systems AS (Norway), Corvus Energy (Canada), and evaluates them on the basis of business strategy excellence and strength of product portfolio within the electric ships ecosystem, combining inputs from various industry experts, buyers, and vendors, and extensive secondary research including annual reports, company press releases, investor presentations, free and paid company databases. They are rated and positioned on 2x2 matrix, called as ‘Company Evaluation Quadrant’, and identified as Visionary Leaders (top companies), Dynamic Differentiators, Innovators, or Emerging companies.
SAMPLES:
Personalize Your Research Requirement
- Updated version of this Quadrant
- Different Company Evaluation Quadrant
- 'Startup Only' Company Evaluation Quadrant
- Region or Country specific evaluation
- Application or Industry specific evaluation ..Read More
Analyst Briefing & Inquiry
- Submit a Briefing Request
- Question about our published research
- Request for evaluation of your organization for specific market
- Request for re-evaluation of Company Evaluation Quadrant ..Read More