
Fiber Optics Quadrant Report
Fiber Optics Market (Global) Company Evaluation Quadrant
Published on
Dec'2019
Pages
53
Code
360-CH 2695
Fiber Optics or Optical Fiber refers to the technology used to transmit a significant amount of information and data as light pulses along with a glass or plastic strand or fiber. Fiber optics, due to their long-distance and high-performance data networking features, are also commonly used in telecommunication services such as the internet, television, and telephones.
The global Fiber Optics market is projected to reach USD 7 billion by 2024. The growth of the fiber optics market is majorly driven by factors such as increasing demand for the internet and the growing need for FTTx. Middle East & Africa is expected to offer a lucrative market growth opportunities to the fiber optics market in the future.
INCREASING CUSTOMER DEMAND FOR INTERNET TO DRIVE THE GROWTH OF THE FIBER OPTICS MARKET
This report identifies and benchmarks the Top Fiber Optics Companies such as Corning Incorporated (US), Prysmian Group (Italy), AFL Global (US), Sumitomo Electric Industries, Ltd (Japan), Leoni AG (Germany), and evaluates them based on business strategy excellence and strength of product portfolio within the Fiber Optics ecosystem, combining inputs from various industry experts, buyers, and vendors, and extensive secondary research including annual reports, company press releases, investor presentations, free and paid company databases. Top Fiber Optics Companies are rated and positioned on a 2x2 matrix, called as ‘Company Evaluation Quadrant,’ and identified as Visionary Leaders ( Best Fiber Optics Companies ), Dynamic Differentiators, Innovators, or Emerging companies.
The report includes market-specific company profiles of 24 Best Fiber Optics Companies and assesses the recent developments that shape the competitive landscape of this highly fragmented market.
List of Top Fiber Optics Companies evaluated and profiled in the report:
- AKSH OPTIFIBRE LIMITED
- AMPHENOL FSI
- ART PHOTONICS GMBH
- AUSTRALIAN FIBRE OPTIC COMMUNICATIONS
- COHERENT, INC.
- CORNING INCORPORATED
- FINOLEX
- FUJIKURA LIMITED
- FURUKAWA ELECTRIC CO. LTD.
- HTL LTD.
- II-VI INCORPORATED
- LEONI AG
- LS CABLE & SYSTEM
- OMAN FIBER OPTIC CO. S.A.O.C. (OFO)
- OPTICAL CABLE CORP. (OCC)
- OPTICAL CABLE CORPORATION
- ORBIS OY
- PRIME OPTICAL FIBER CORPORATION (POFC)
- PRYSMIAN GROUP
- RPG CABLES
- STERLITE TECHNOLOGIES LIMITED
- SUMITOMO ELECTRIC INDUSTRIES, LTD (SEI)
- TRATOS
- YANGTZE OPTICAL FIBRE AND CABLE CO., LTD.
Table of Contents
1 Introduction
1.1 Market Definition
2 Market Overview
2.1 Introduction
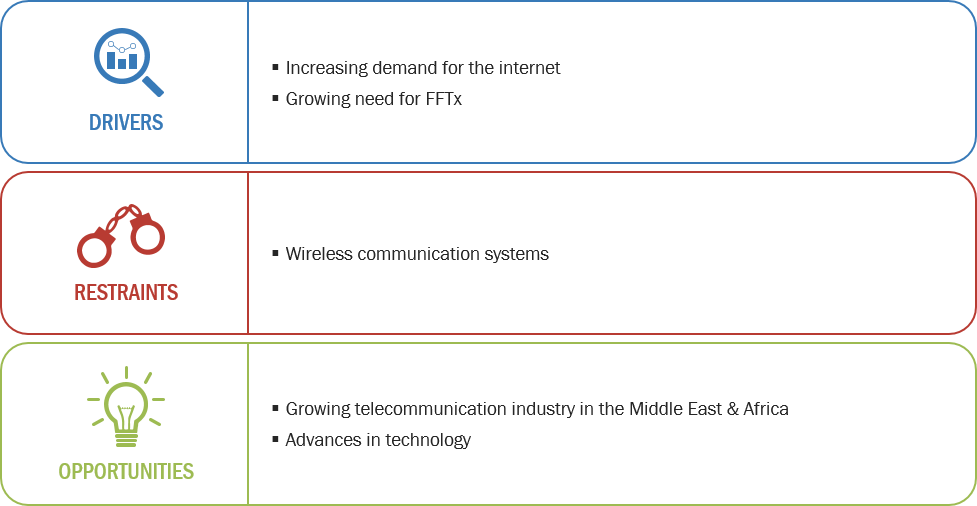
2.2 Market Dynamics
Figure 1 Drivers, Restraints, and Opportunities in the Fiber Optics Market
2.2.1 Drivers
2.2.1.1 Increasing Demand for the Internet
2.2.1.2 Growing Need for FTTx
2.2.2 Restraints
2.2.2.1 Wireless Communication Systems
Table 1 Comparison of Wireless Technology and Fiber Optics-Based Technology on Various Parameters
2.2.3 Opportunities
2.2.3.1 Growing Telecommunication Industry in the Middle East & Africa
2.2.3.2 Advances in Technology
2.3 Porter’s Five Forces Analysis
Figure 2 Fiber Optics Market: Porter’s Five Forces Analysis
2.3.1 Threat of New Entrants
2.3.2 Threat of Substitutes
2.3.3 Bargaining Power of Suppliers
2.3.4 Bargaining Power of Buyers
2.3.5 Intensity of Competitive Rivalry
2.4 Industry Outlook
Table 2 APAC: Individuals Using the Internet (% of Population), By Key Country, 2017
Table 3 North America: Individuals Using the Internet (% of Population), By Key Country, 2017
Table 4 Europe: Individuals Using the Internet (% of Population), By Key Country, 2017
Table 5 South America: Individuals Using the Internet (% of Population), By Key Country, 2017
Table 6 Middle East & Africa: Individuals Using the Internet (% of Population), By Key Country, 2017
3 Company Evaluation Quadrant
3.1 Visionary Leaders
3.2 Innovators
3.3 Dynamic Differentiators
Figure 3 Fiber Optics Market: Company Evaluation Quadrant
3.4 Strength of Product Portfolio
3.5 Business Strategy Excellence
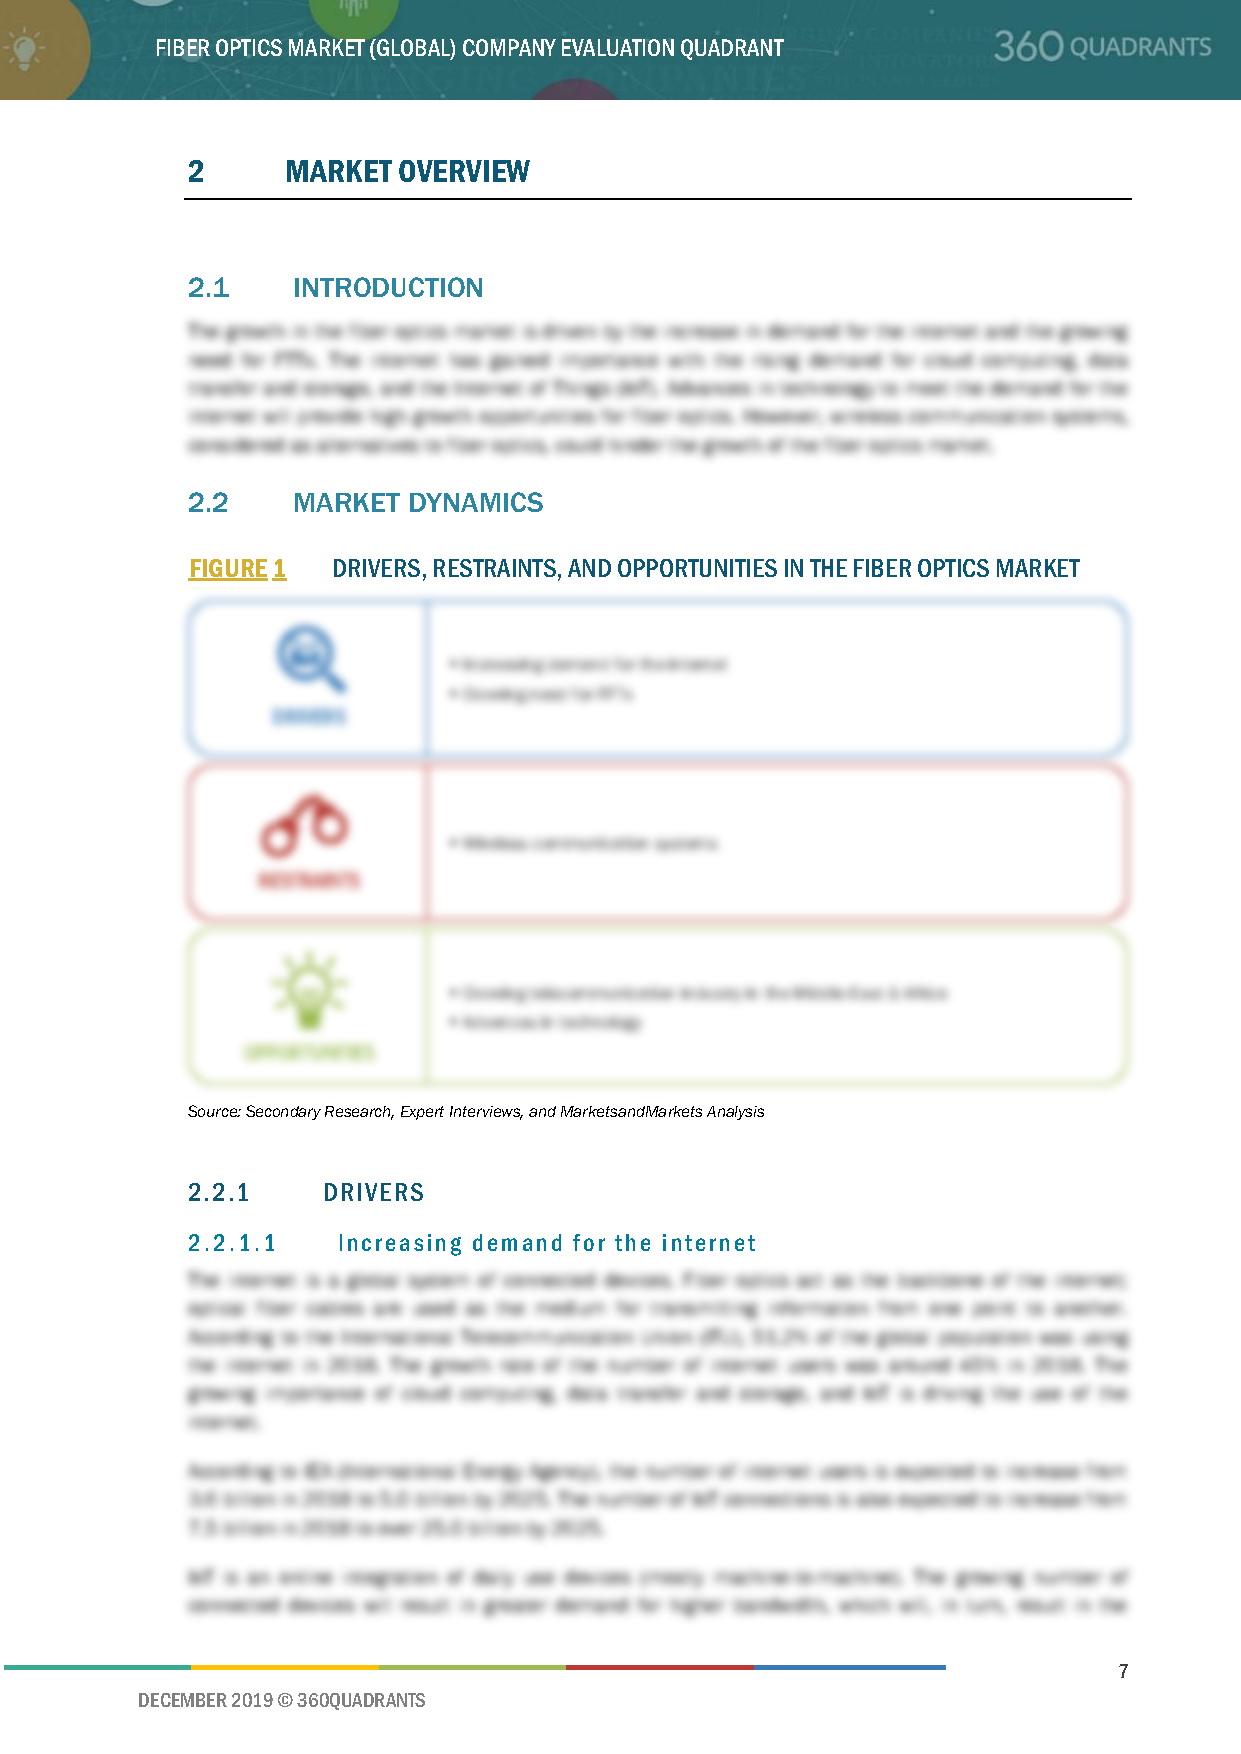
4 Company Evaluation Quadrant Smes
4.1 Progressive Companies
4.2 Responsive Companies
4.3 Starting Blocks
Figure 4 Fiber Optics Market (Small and Medium-Sized Enterprises) Company Evaluation Quadrant
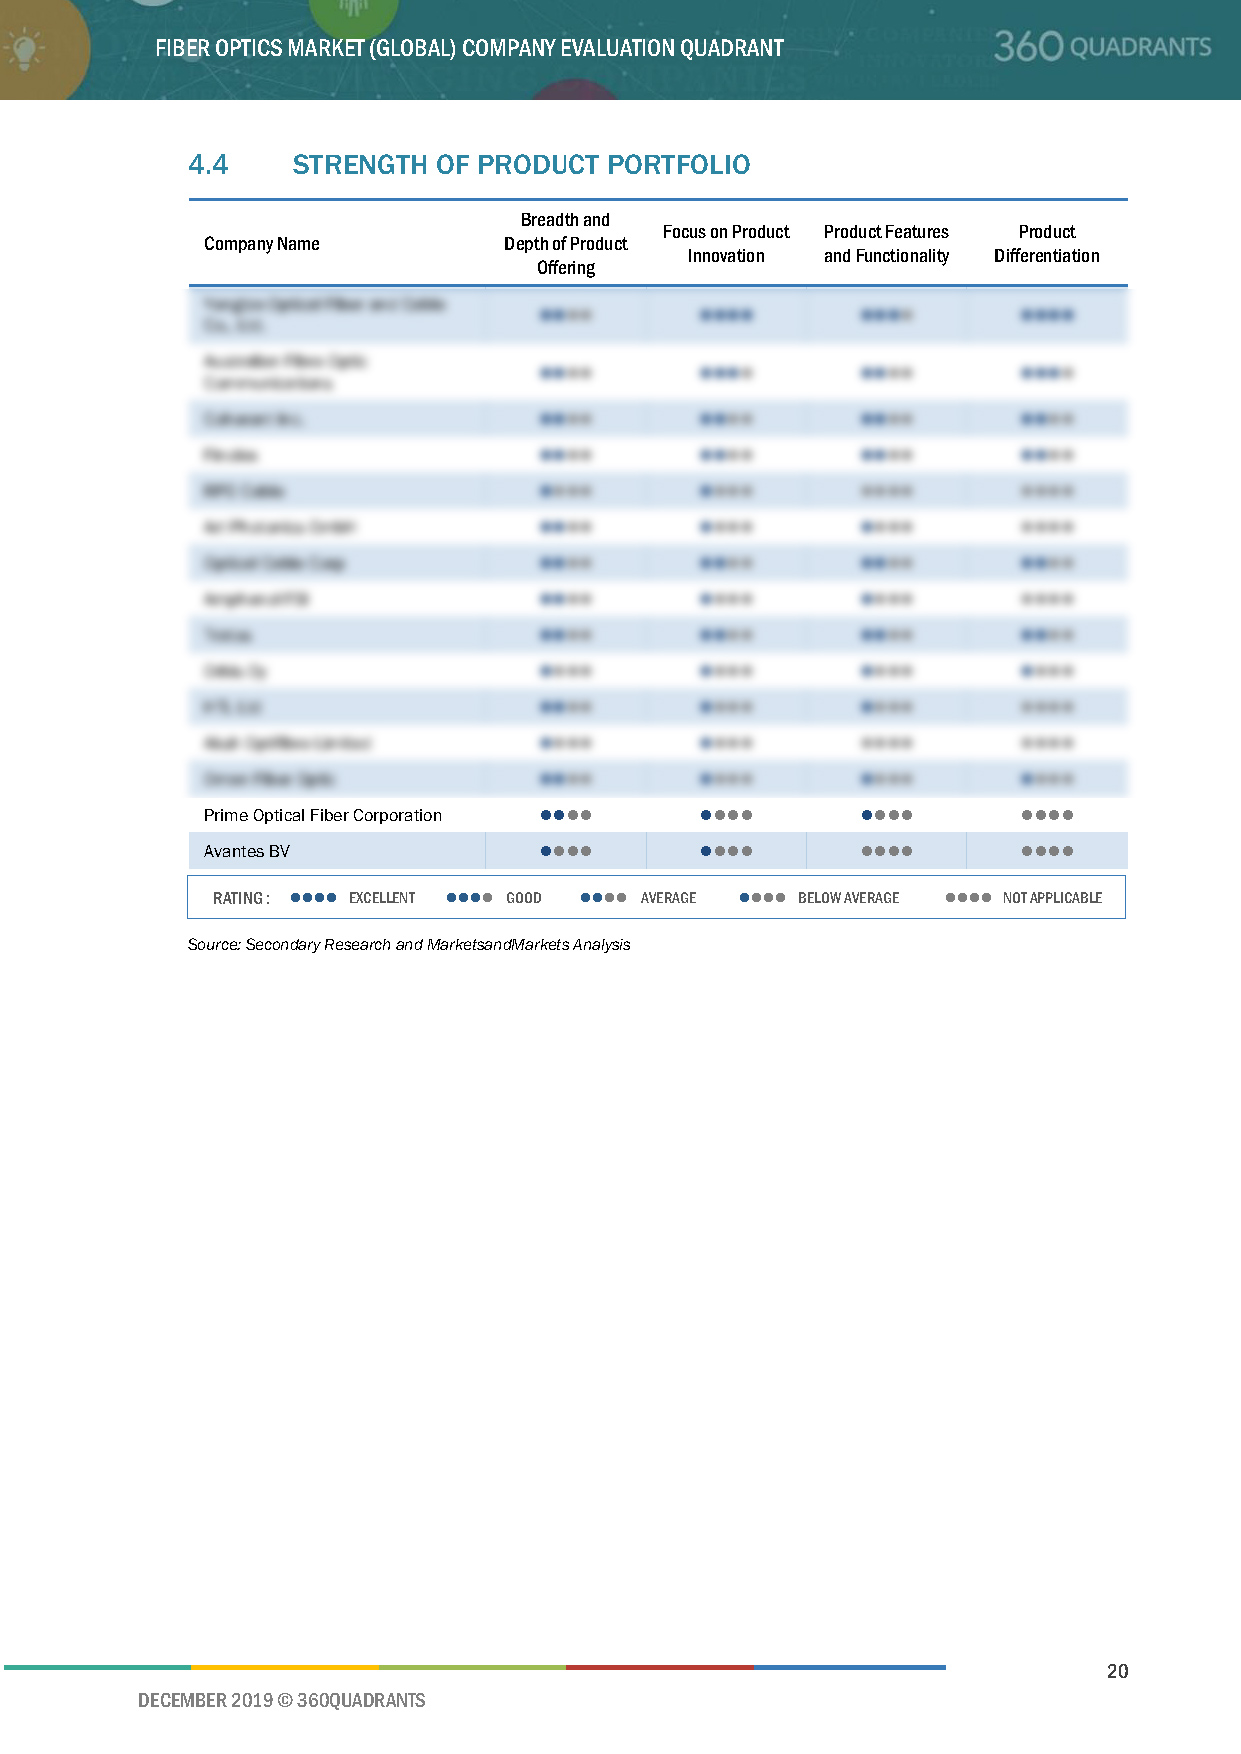
4.4 Strength of Product Portfolio
4.5 Business Strategy Excellence
5 Competitive Landscape
5.1 Introduction
5.2 Market Share Analysis
Figure 5 Fiber Optics Market Share, By Company, 2018
5.2.1 Corning Incorporated
5.2.2 Prysmian Group
5.3 Competitive Scenario
5.3.1 Expansion
Table 7 Expansion, 2016–2019
5.3.2 Acquisition
Table 8 Acquisition, 2016–2019
5.3.3 New Product Launch
Table 9 New Product Launch, 2016–2019
5.3.4 Agreement
Table 10 Agreement, 2016–2019
5.3.5 Investment
Table 11 Investment, 2016–2019
5.3.6 Partnership
Table 12 Partnership, 2016–2019
5.3.7 Joint Venture
Table 13 Joint Venture, 2016–2019
6 Company Profiles
6.1 Corning Incorporated
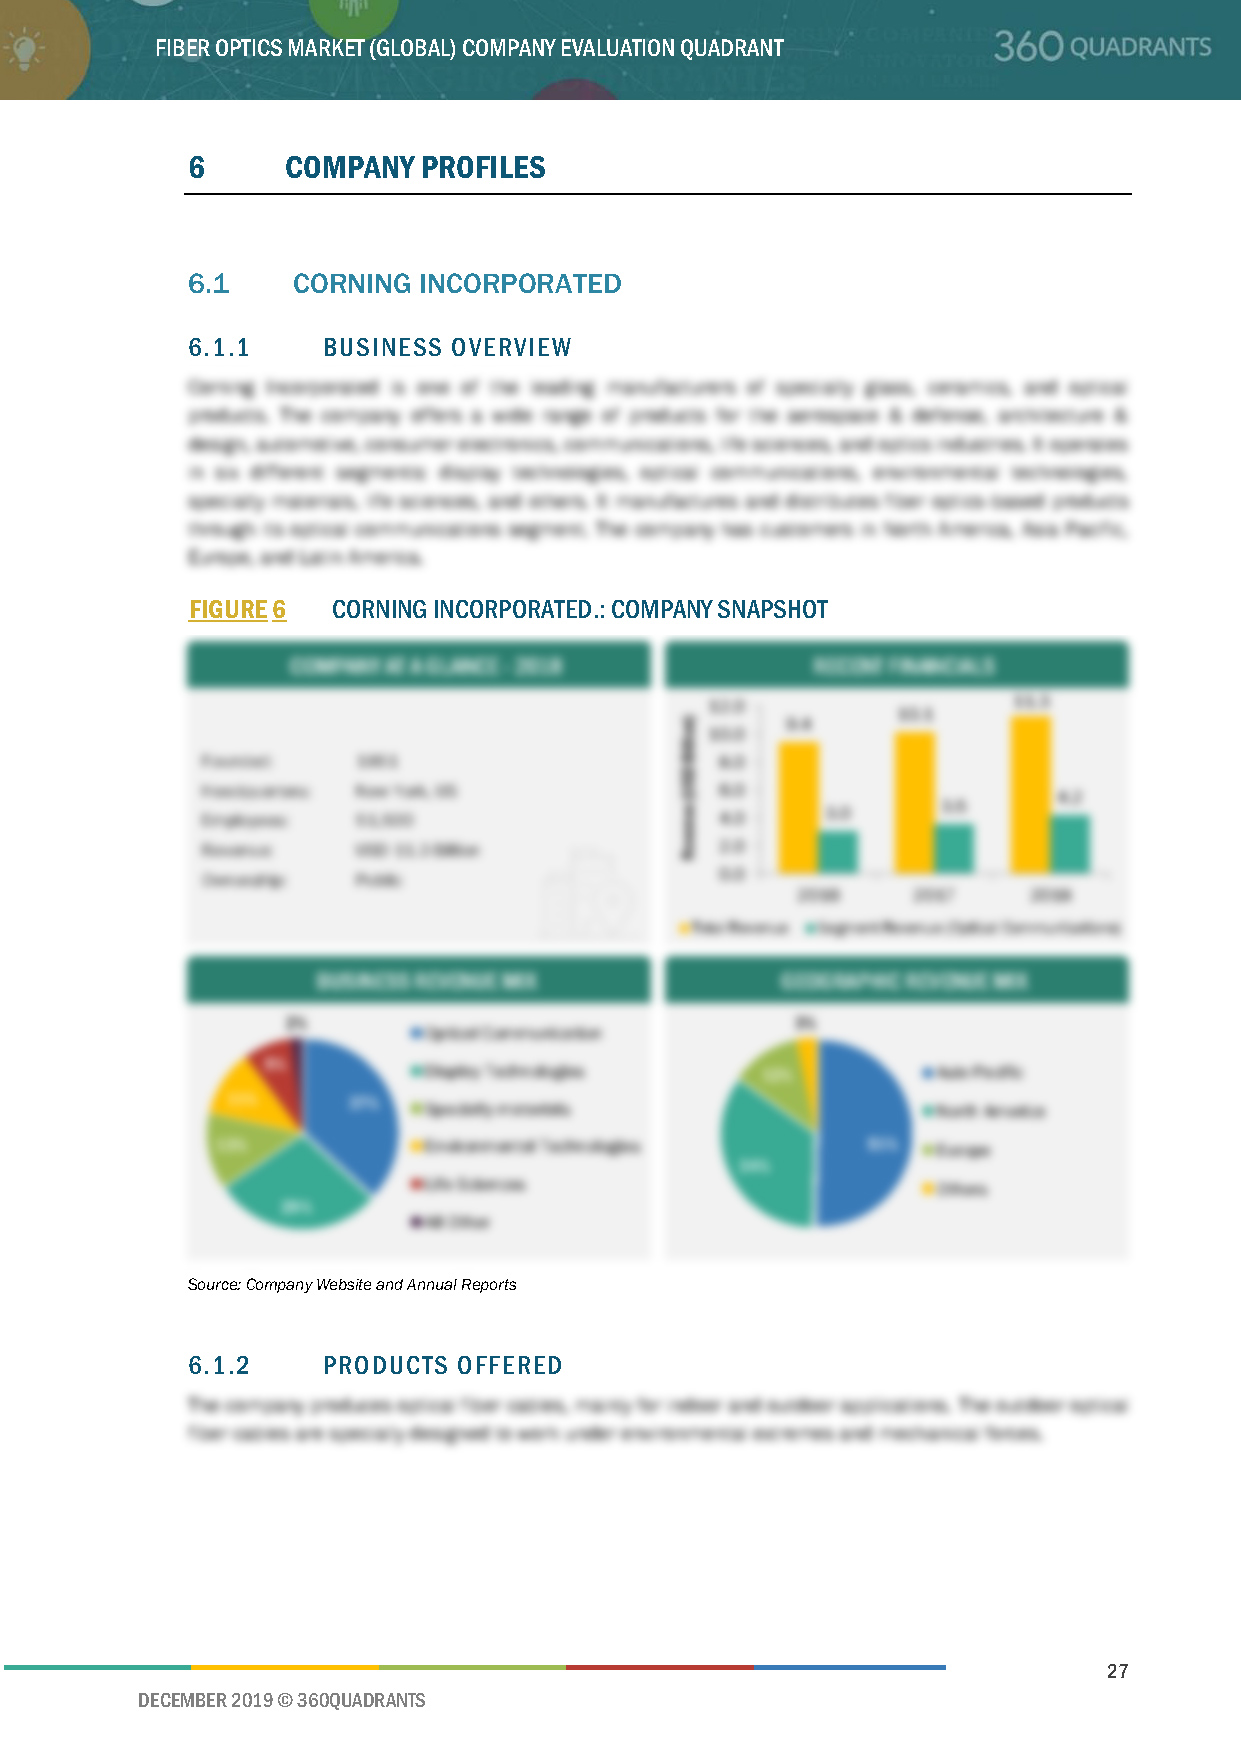
6.1.1 Business Overview*
Figure 6 Corning Incorporated: Company Snapshot
6.1.2 Products Offered*
6.1.3 Recent Developments*
6.1.4 SWOT Analysis*
Figure 7 Corning Incorporated: SWOT Analysis
(*Above sections are present for all of below companies)
6.1.5 Current Focus & Strategies
6.1.6 Threat From Competition
6.1.7 Right to Win
6.2 Prysmian Group
Figure 8 Prysmian Group: Company Snapshot
Figure 9 Prysmian Group: SWOT Analysis
6.3 Ii-Vi Incorporated
Figure 10 Ii-Vi Incorporated: Company Snapshot
Figure 11 Ii-Vi Incorporated: SWOT Analysis
6.4 Sumitomo Electric Industries, Ltd (SEI)
Figure 12 Sumitomo Electric Industries, Ltd.: Company Snapshot
Figure 13 Sumitomo Electric Industries, Ltd.: SWOT Analysis
6.5 LS Cable & System
Figure 14 LS Cable & System: Company Snapshot
6.6 Leoni AG
Figure 15 Leoni AG: Company Snapshot
6.7 Furukawa Electric Co. Ltd.
Figure 16 Furukawa Electric Co. Ltd.: Company Snapshot
6.8 Sterlite Technologies Limited
Figure 17 Sterlite Technologies Limited: Company Snapshot
6.9 Optical Cable Corporation
Figure 18 Optical Cable Corporation: Company Snapshot
6.10 Fujikura Limited
Figure 19 Fujikura Limited: Company Snapshot
6.11 Yangtze Optical Fibre and Cable Co., Ltd.
Figure 20 Yangtze Optical Fibre and Cable Co., Ltd.: Company Snapshot
7 Appendix
7.1 Methodology
This report identifies and benchmarks the Best Fiber Optics Companies such as Corning Incorporated (US), Prysmian Group (Italy), Finisar (US), AFL Global (US), Sumitomo Electric Industries, Ltd (Japan), and evaluates them based on business strategy excellence and strength of product portfolio within the Fiber Optics market ecosystem, combining inputs from various industry experts, buyers, and vendors, and extensive secondary research including annual reports, company press releases, investor presentations, free and paid company databases. Fiber Optics Leaders are rated and positioned on a 2x2 matrix, called as ‘Company Evaluation Quadrant,’ and identified as Visionary Leaders ( Best Fiber Optics Companies ), Dynamic Differentiators, Innovators, or Emerging companies.
SAMPLES:
Personalize Your Research Requirement
- Updated version of this Quadrant
- Different Company Evaluation Quadrant
- 'Startup Only' Company Evaluation Quadrant
- Region or Country specific evaluation
- Application or Industry specific evaluation ..Read More
Analyst Briefing & Inquiry
- Submit a Briefing Request
- Question about our published research
- Request for evaluation of your organization for specific market
- Request for re-evaluation of Company Evaluation Quadrant ..Read More