Personalized Nutrition Quadrant Report

Table of Contents
1 Introduction
1.1 Market Definition
2 Market Overview
2.1 Introduction
Figure 1 Personalized Nutrition Market: YC and YCC Shift
2.2 Market Dynamics
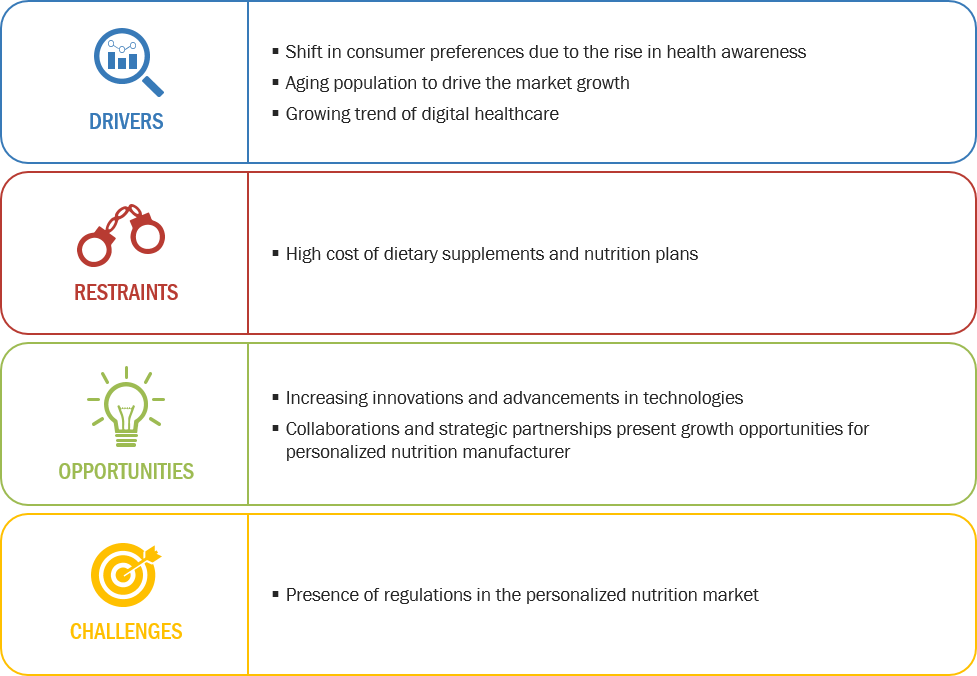
Figure 2 Personalized Nutrition Market: Drivers, Restraints, Opportunities, and Challenges
2.2.1 Drivers
2.2.1.1 Shift in Consumer Preferences Due to the Rise in Health Awareness
2.2.1.2 Aging Population to Drive the Market Growth
Figure 3 Aging Population in Japan
Figure 4 Business Model of Nestle in the Personalized Nutrition Market
2.2.1.3 Growing Trend of Digital Healthcare
Figure 5 Digital Health Tools Used in the Personalized Nutrition Market
2.2.2 Restraints
2.2.2.1 High Cost of Dietary Supplements and Nutrition Plans
2.2.3 Opportunities
2.2.3.1 Increasing Innovations and Advancements in Technologies
2.2.3.2 Collaborations and Strategic Partnerships Present Growth Opportunities for Personalized Nutrition Manufacturers
2.2.4 Challenges
2.2.4.1 Presence of Regulations in the Personalized Nutrition Market
2.3 Patent Analysis
Figure 6 Number of Patents Approved for Personalized Nutrition, By Applicant, 2018–2019
Table 1 List of Important Patents for Personalized Nutrition, 2013–2018
2.4 Regulations
3 Case Study Depicting Growth of the Personalized Nutrition Market
3.1 Introduction
3.2 Evolution and Growth of the Personalized Nutrition Market
3.3 Introduction Phase: Late 2010
3.4 New Entrant (Start-Up) Phase, Key Companies, 2011–2015
3.5 Disruption/Partnership Phase, Key Companies, 2015–2019
3.6 Future Expansion and Opportunities: 2020 and Beyond
4 Company Evaluation Quadrant
4.1 Overview
4.2 Company Evaluation Quadrant (By Technology)
4.2.1 Dynamic Differentiators
4.2.2 Innovators
4.2.3 Visionary Leaders
4.2.4 Emerging Companies
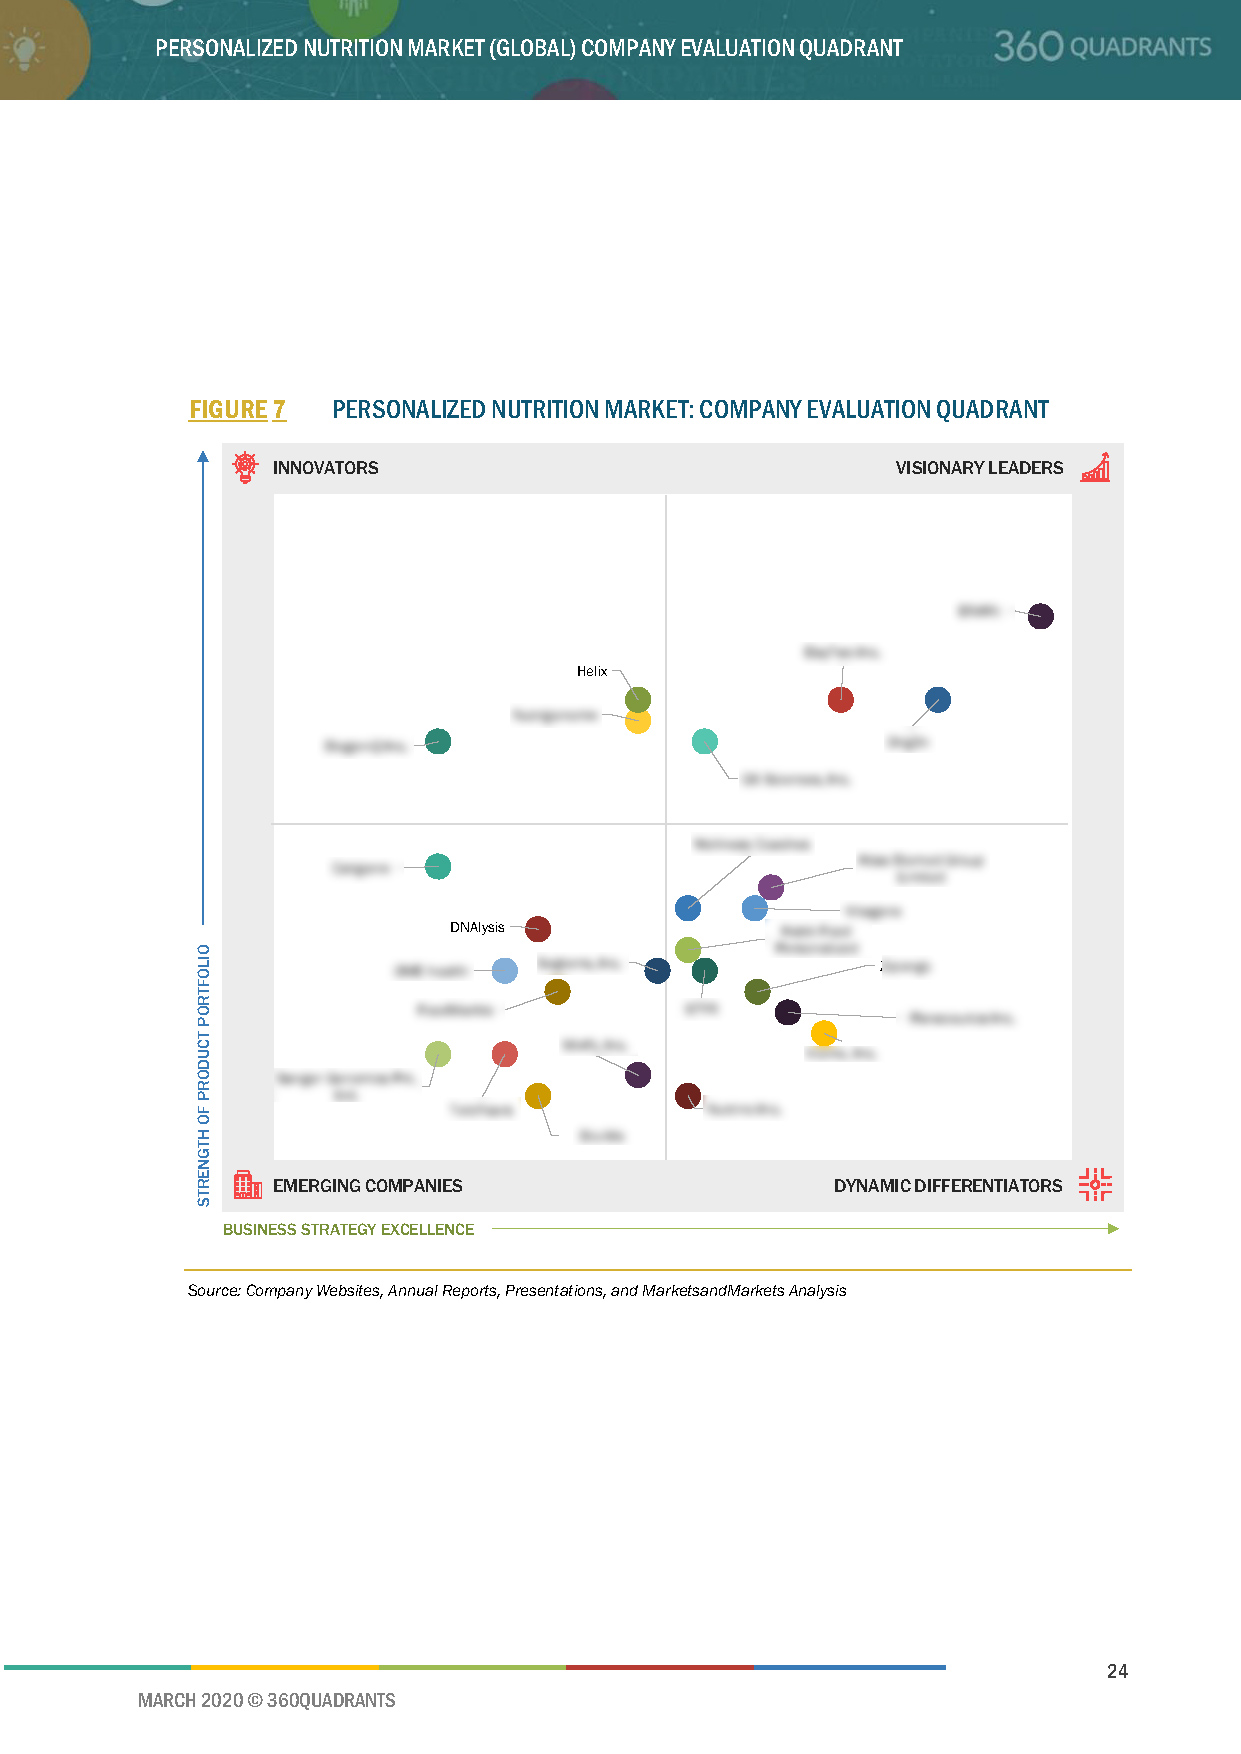
Figure 7 Personalized Nutrition Market: Company Evaluation Quadrant
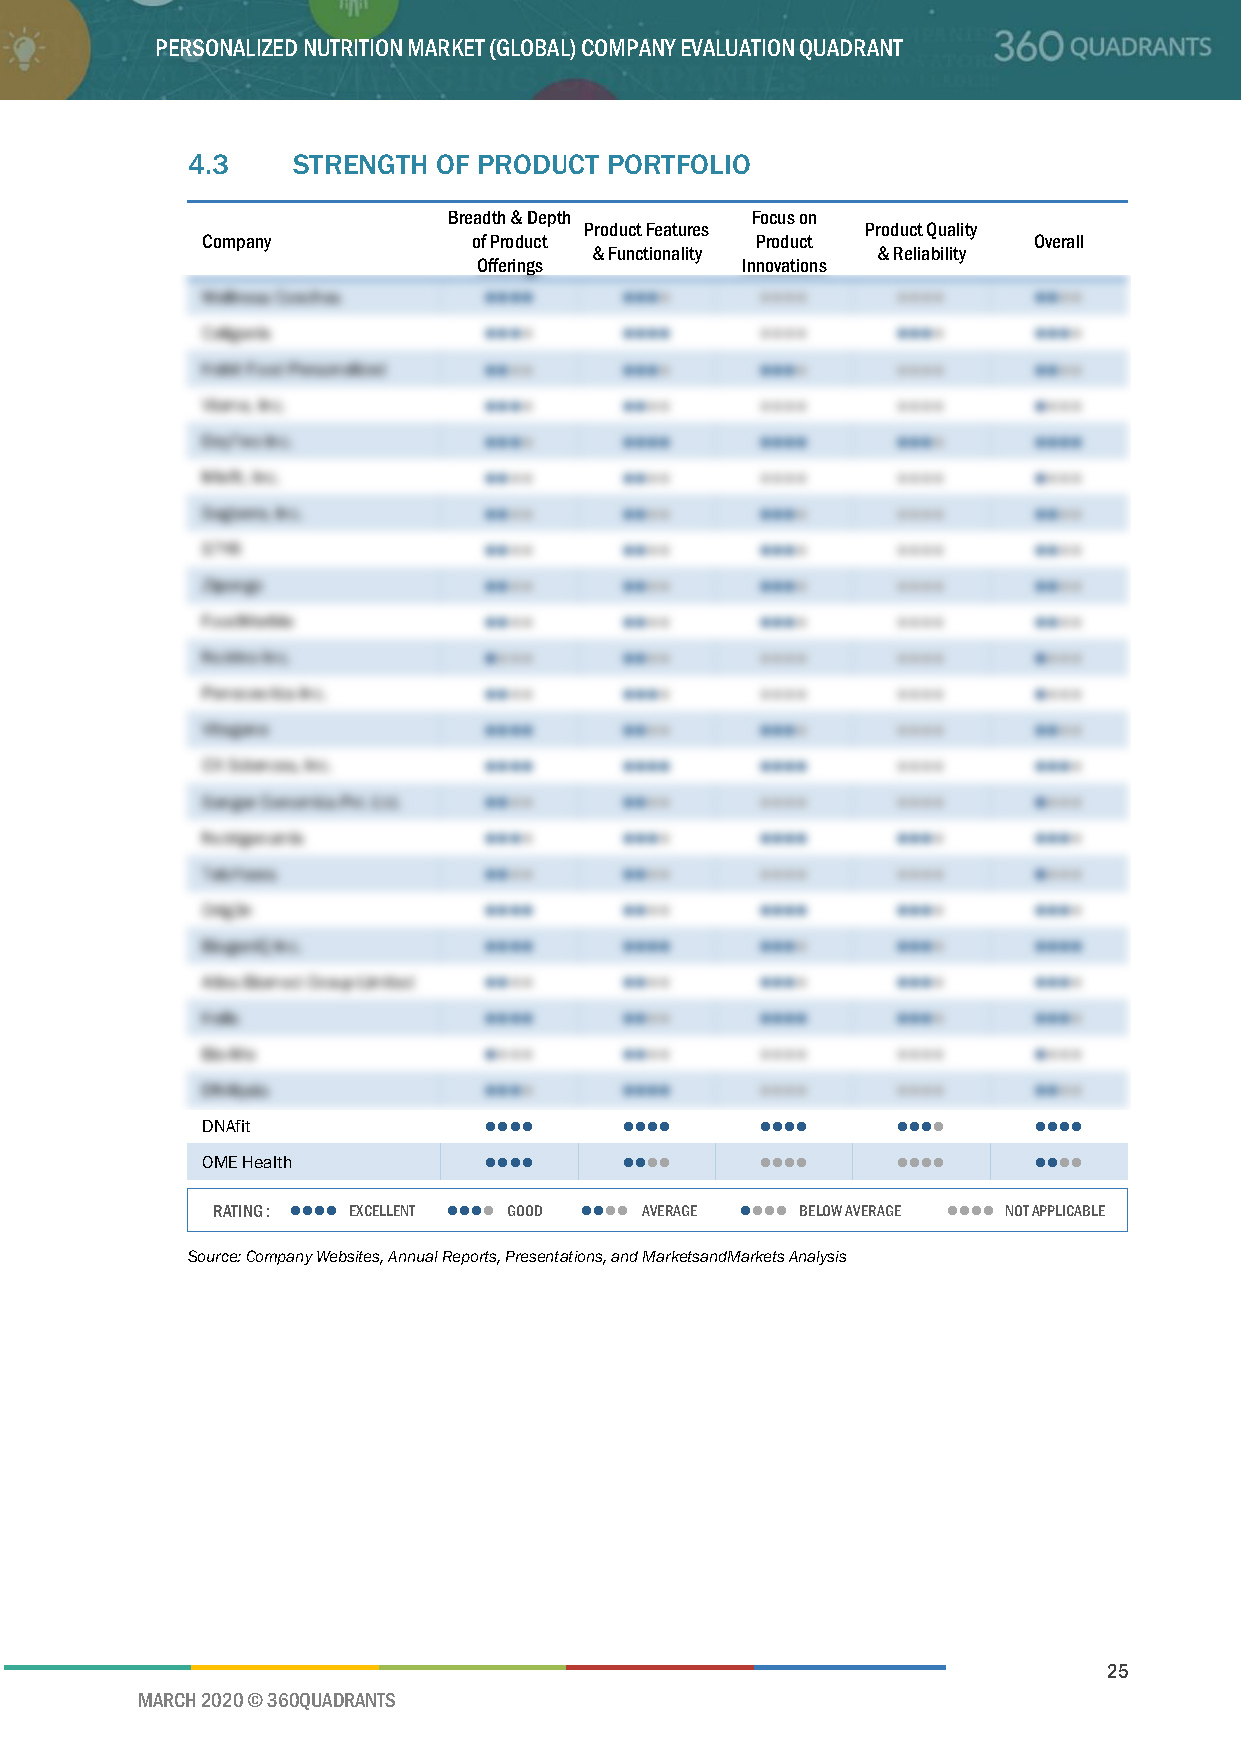
4.3 Strength of Product Portfolio
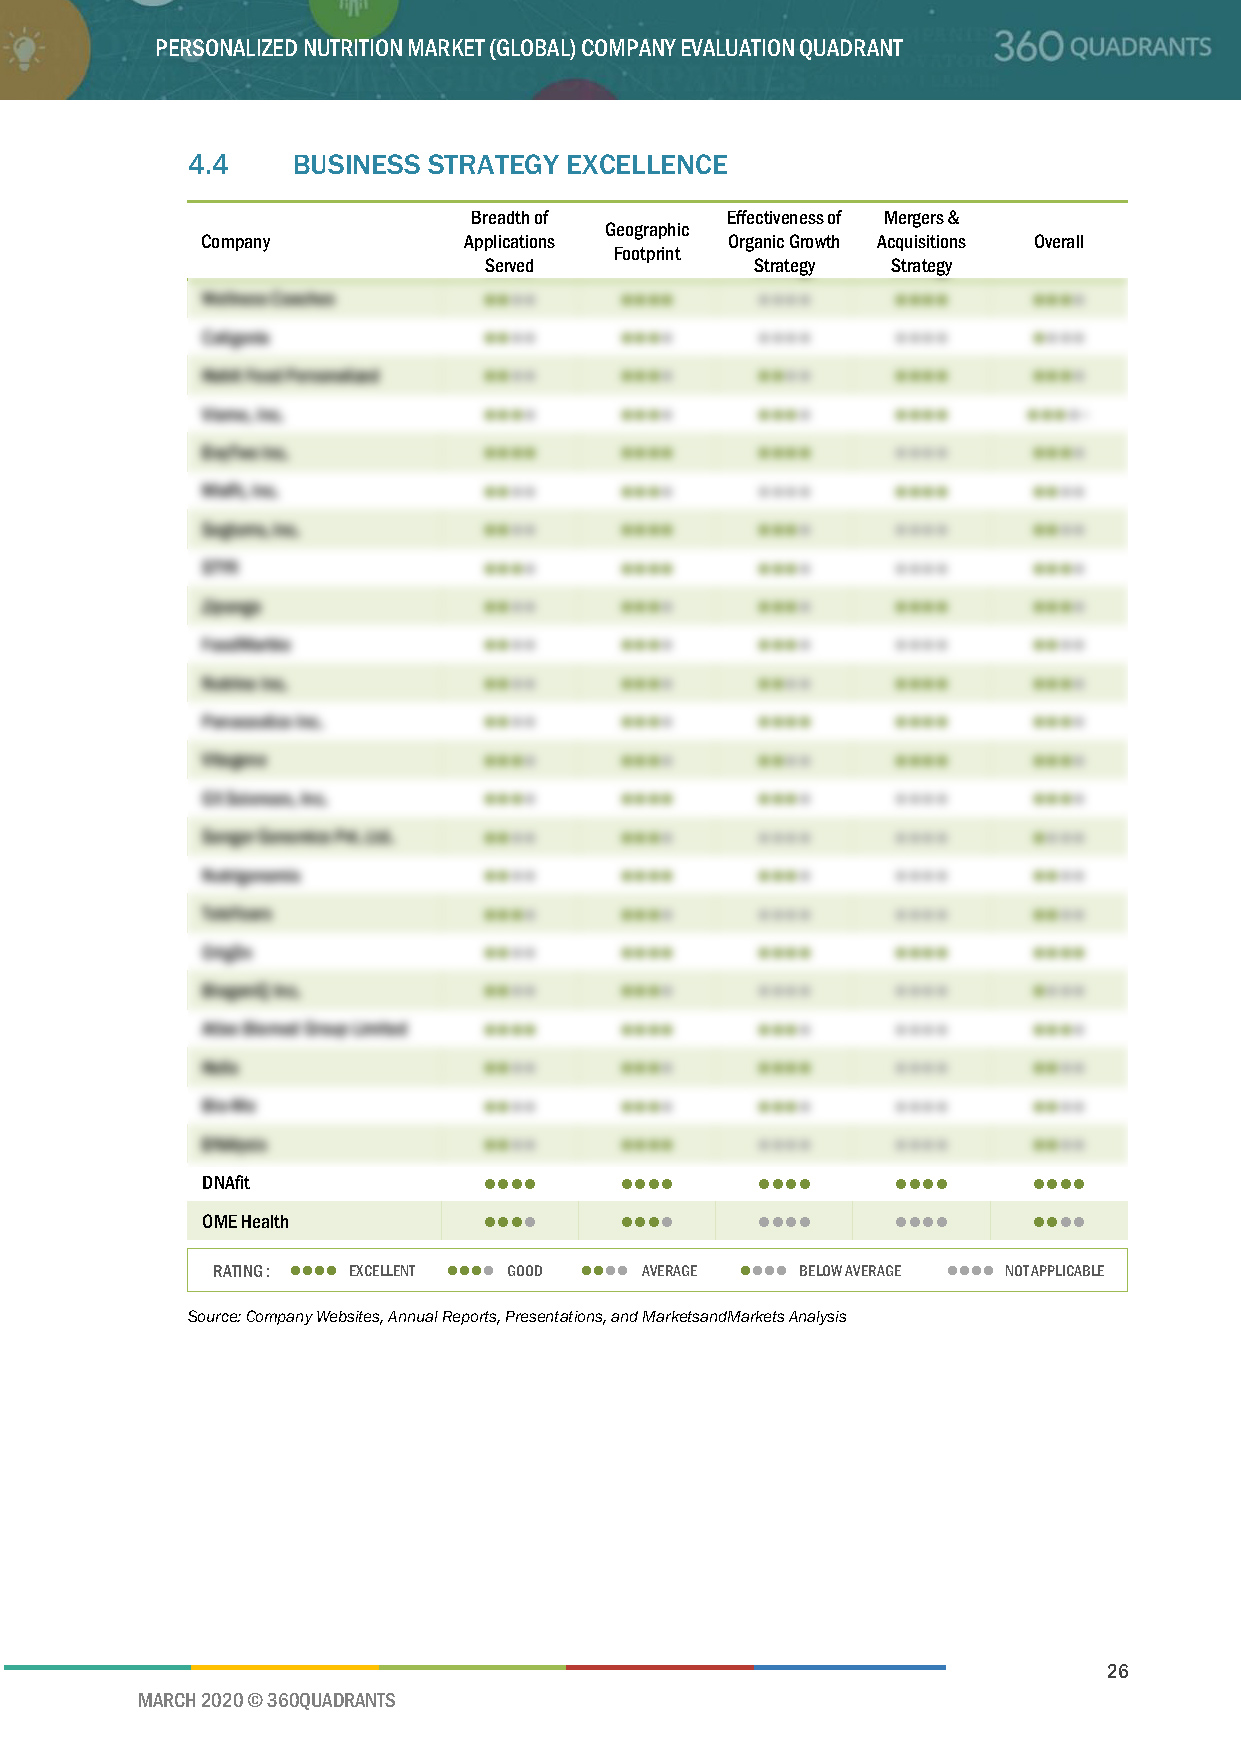
4.4 Business Strategy Excellence
4.5 Company Evaluation Quadrant (Products and Plans)
4.5.1 Dynamic Differentiators
4.5.2 Innovators
4.5.3 Visionary Leaders
4.5.4 Emerging Companies
Figure 8 Personalized Nutrition Market: Company Evaluation Quadrant
4.6 Strength of Product Portfolio
4.7 Business Strategy Excellence
5 Competitive Landscape
Figure 9 Key Developments of Leading Players in the Personalized Nutrition Market, 2017–2020
5.1 Expansions & Investments
Table 2 Expansions & Investments, 2017–2020
5.2 New Product Launches
Table 3 New Product Launches, 2017–2020
5.3 Mergers & Acquisitions
Table 4 Mergers & Acquisitions, 2017–2020
5.4 Agreements, Joint Ventures, and Partnerships
Table 5 Agreements, Joint Ventures, and Partnerships, 2017–2020
6 Company Profiles
6.1 Companies With Tech Partnerships
6.1.1 BASF SE
6.1.1.1 Business Overview*
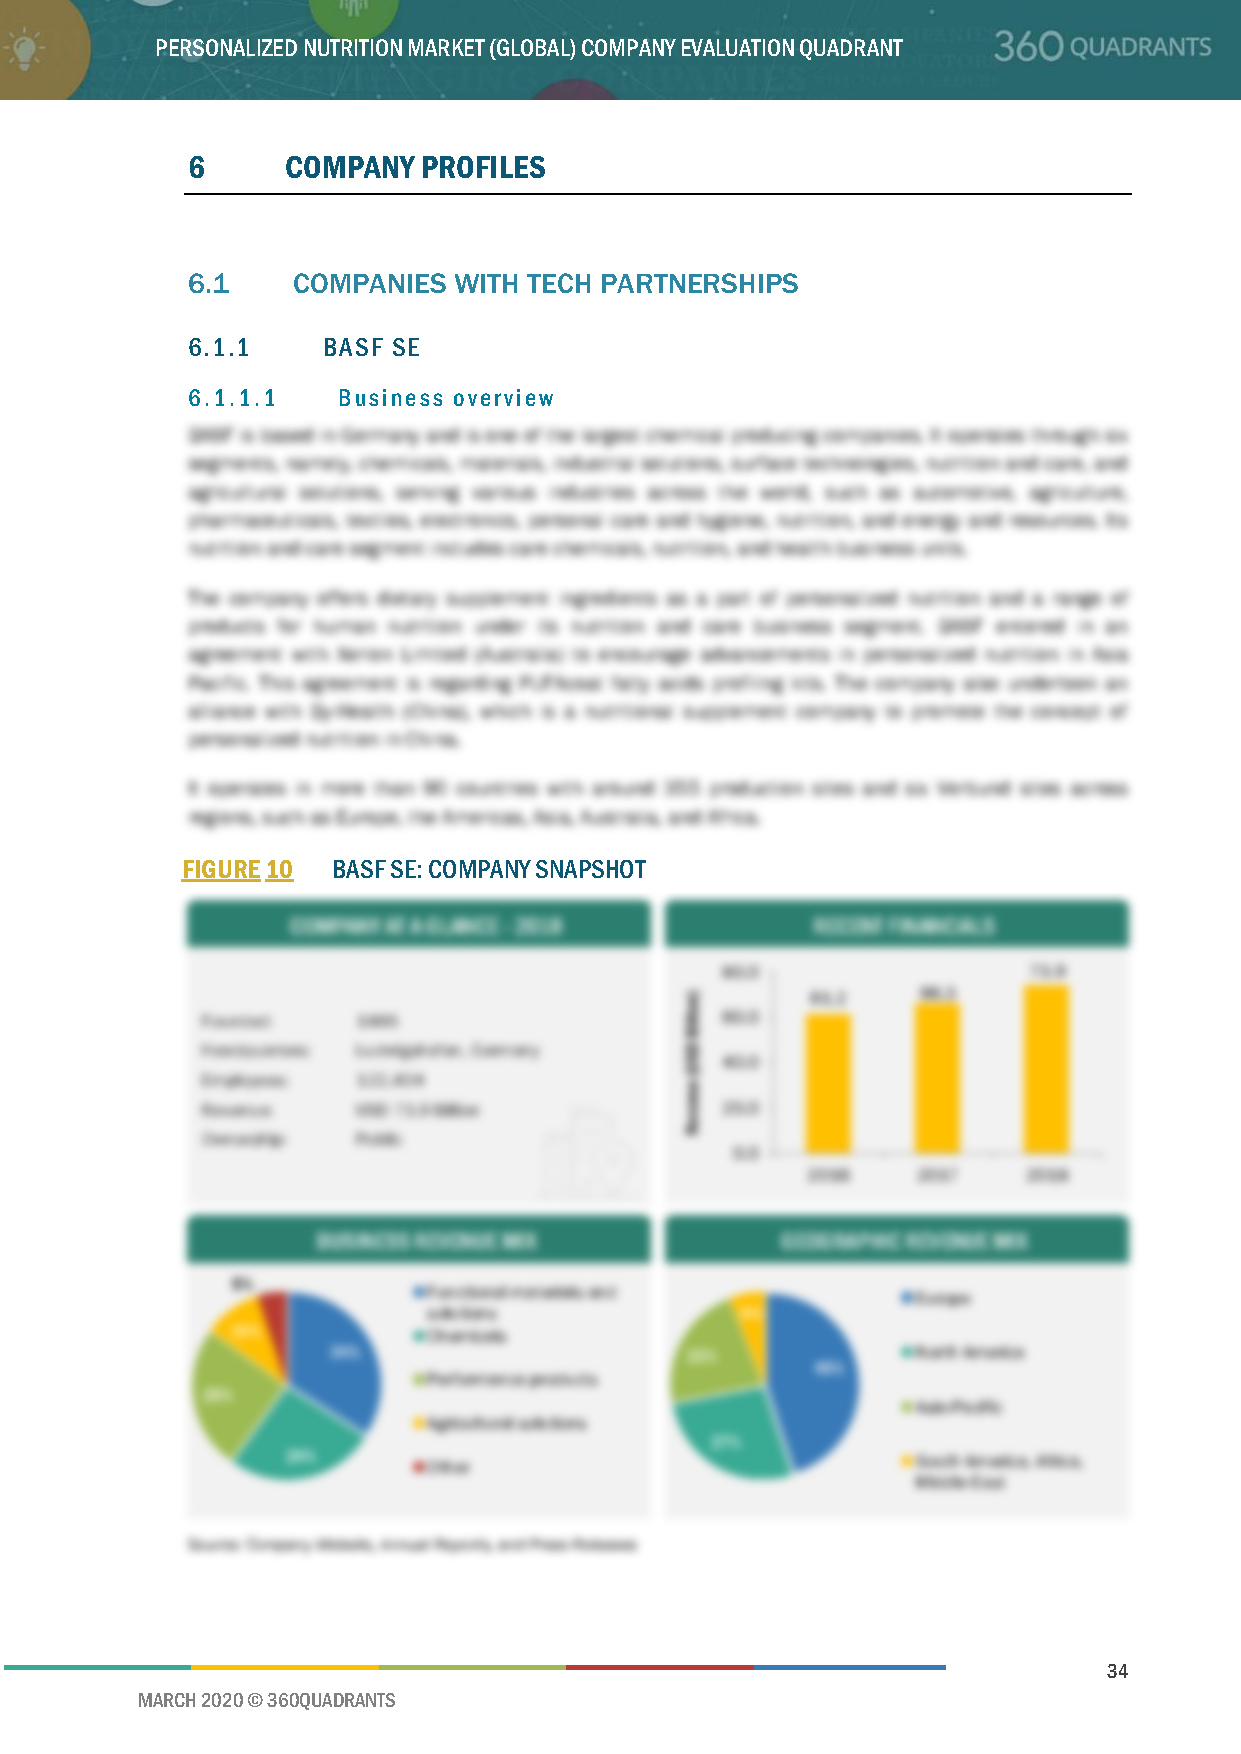
Figure 10 BASF SE: Company Snapshot
6.1.1.2 Products Offered*
6.1.1.3 SWOT Analysis*
Figure 11 BASF SE: SWOT Analysis
6.1.1.4 Recent Developments*
6.1.1.5 Right to Win*
(*Above sections are present for all of below companies)
6.1.2 DSM
Figure 12 DSM: Company Snapshot
Figure 13 DSM: SWOT Analysis
6.2 Companies With Tech Capabilities
6.2.1 Herbalife Nutrition Ltd.
Figure 14 Herbalife Nutrition: Company Snapshot
Figure 15 Herbalife Nutrition Ltd.: SWOT Analysis
6.2.2 Amway
Figure 16 Amway: Company Snapshot
Figure 17 Amway: SWOT Analysis
6.2.3 DNAfit
6.2.4 Wellness Coaches
6.2.5 Atlas Biomed Group Limited
6.2.6 Care/of
6.2.7 Habit Food Personalized, LLC
6.2.8 Persona
6.2.9 Bactolac Pharmaceutical, Inc.
6.2.10 Balchem Corporation
Figure 18 Balchem Corporation: Company Snapshot
6.2.11 Zipongo
6.2.12 DNAlysis
6.2.13 Sanger Genomics Pvt Ltd.
6.2.14 DayTwo Inc.
6.2.15 mindbodygreen
6.2.16 BiogeniQ
6.2.17 Helix
6.2.18 Segterra, Inc.
6.2.19 Metagenics, Inc.
6.2.20 Baze
6.2.21 GX Sciences, Inc.
6.2.22 Nutrigenomix
7 Appendix
7.1 Methodology
This report identifies and benchmarks best personalized nutrition companies such Wellness Coaches, Atlas Biomed, Vitagene, Amway, Persona, Habit Food Personalized, and evaluates them on the basis of business strategy excellence and strength of product portfolio within the personalized nutrition ecosystem, combining inputs from various industry experts, buyers, and vendors, and extensive secondary research including annual reports, company press releases, investor presentations, free and paid company databases. They are rated and positioned on a 2x2 matrix, called as ‘Company Evaluation Quadrant,’ and identified as Visionary Leaders, Dynamic Differentiators, Innovators, or Emerging companies.
SAMPLES:
- Updated version of this Quadrant
- Different Company Evaluation Quadrant
- 'Startup Only' Company Evaluation Quadrant
- Region or Country specific evaluation
- Application or Industry specific evaluation ..Read More
- Submit a Briefing Request
- Question about our published research
- Request for evaluation of your organization for specific market
- Request for re-evaluation of Company Evaluation Quadrant ..Read More
