
Smart Factory Solutions Quadrant Report
Smart Factory Market (Global) Company Evaluation Quadrant
Published on
Mar'2019
Pages
74
Code
360-SE 3068
The main advantage of smart factory is the ability to evolve and grow along with the changing needs of the organization. The smart factory uses a network to connect virtual and physical elements of the production process to the actual manufacturing operations. It represents an autonomous manufacturing environment that can handle any technical issues during real-time production, using fragmented information and communication structures, for an optimum management of production processes. Smart factory is an emerging trend that encompasses set of technologies, solutions, and products. It connects people, processes, and machines in industrial environment to enable advance manufacturing. Smart factory offers multiple benefits that help users to optimize process, reduce errors, improve quality, and eliminate waste.
Smart Factory has encompassed variety of players within its ecosystem and this can be characterized as broad, overlapped, and complex. Companies from Information and communication technologies, cloud, software solutions, device & equipment, system integration, and manufacturing background are present in this ecosystem. A user-centered approach to industrial processes, as along with creating a holistic view of processes, machines, and the people in-between is a key for a company to sustain this business. It is expected that the Smart Factory Market will reach USD 245 billion by 2024, due to various drivers such as: Increasing adoption of industrial robots, evolution of Internet Of Things, and growing demand for smart automation solutions.
Market growth is propelled by increasing emphasis on real-time data analysis, enhanced visibility, and predictive maintenance.
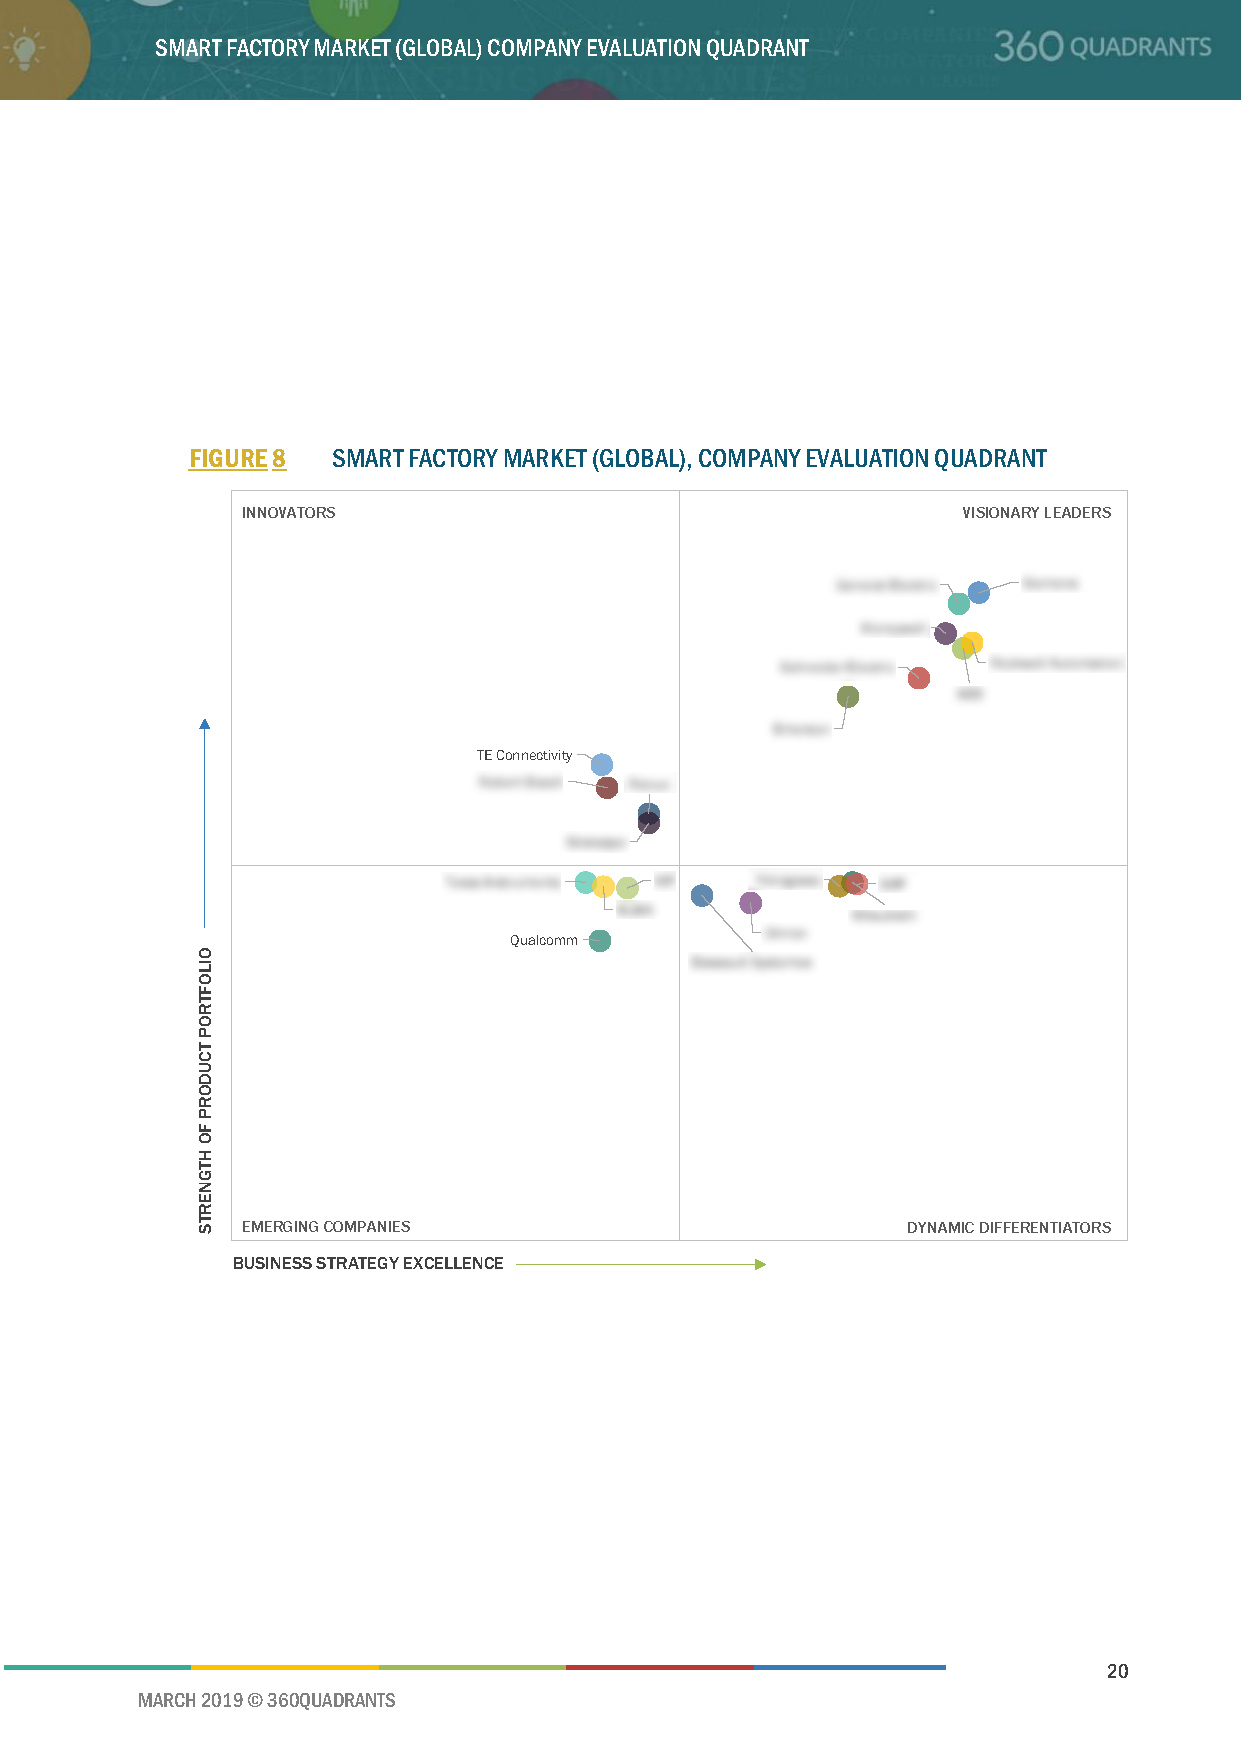
This report identifies and benchmarks key market players such as ABB (Switzerland), General Electric (US), Honeywell International (US), Rockwell Automation (US), Siemens (Germany), and evaluates them on the basis of business strategy excellence and strength of product portfolio within the smart factory ecosystem, combining inputs from various industry experts, buyers, and vendors, and extensive secondary research including annual reports, company press releases, investor presentations, free and paid company databases. They are rated and positioned on 2x2 matrix, called as ‘Company Evaluation Quadrant’, and identified as Visionary Leaders (best smart factory solution providers), Dynamic Differentiators, Innovators, or Emerging companies.
The report includes market specific company profiles of 20 top smart factory companies and assesses the recent developments that shape the competitive landscape of this highly fragmented market.
List of companies evaluated and profiled in the report:
- ABB (SWITZERLAND)
- DASSAULT SYSTEMES (FRANCE)
- EMERSON ELECTRIC (US)
- FANUC (JAPAN)
- GENERAL ELECTRIC (US)
- HONEYWELL INTERNATIONAL (US)
- HP (US)
- KUKA (GERMANY)
- MITSUBISHI ELECTRIC (JAPAN)
- OMRON (JAPAN)
- QUALCOMM (US)
- ROBERT BOSCH (GERMANY)
- ROCKWELL AUTOMATION (US)
- SAP (GERMANY)
- SCHNEIDER ELECTRIC (FRANCE)
- SIEMENS (GERMANY)
- STRATASYS (US)
- TE CONNECTIVITY (SWITZERLAND)
- TEXAS INSTRUMENTS (US)
- YOKOGAWA ELECTRIC (JAPAN)
Table of Contents
1 Introduction
1.1 Definition
2 Market Overview
2.1 Introduction
2.2 Market Dynamics
Figure 1 DROC: Smart Factory Market
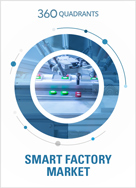
2.2.1 Drivers
2.2.1.1 Growing Demand for Industrial Robots
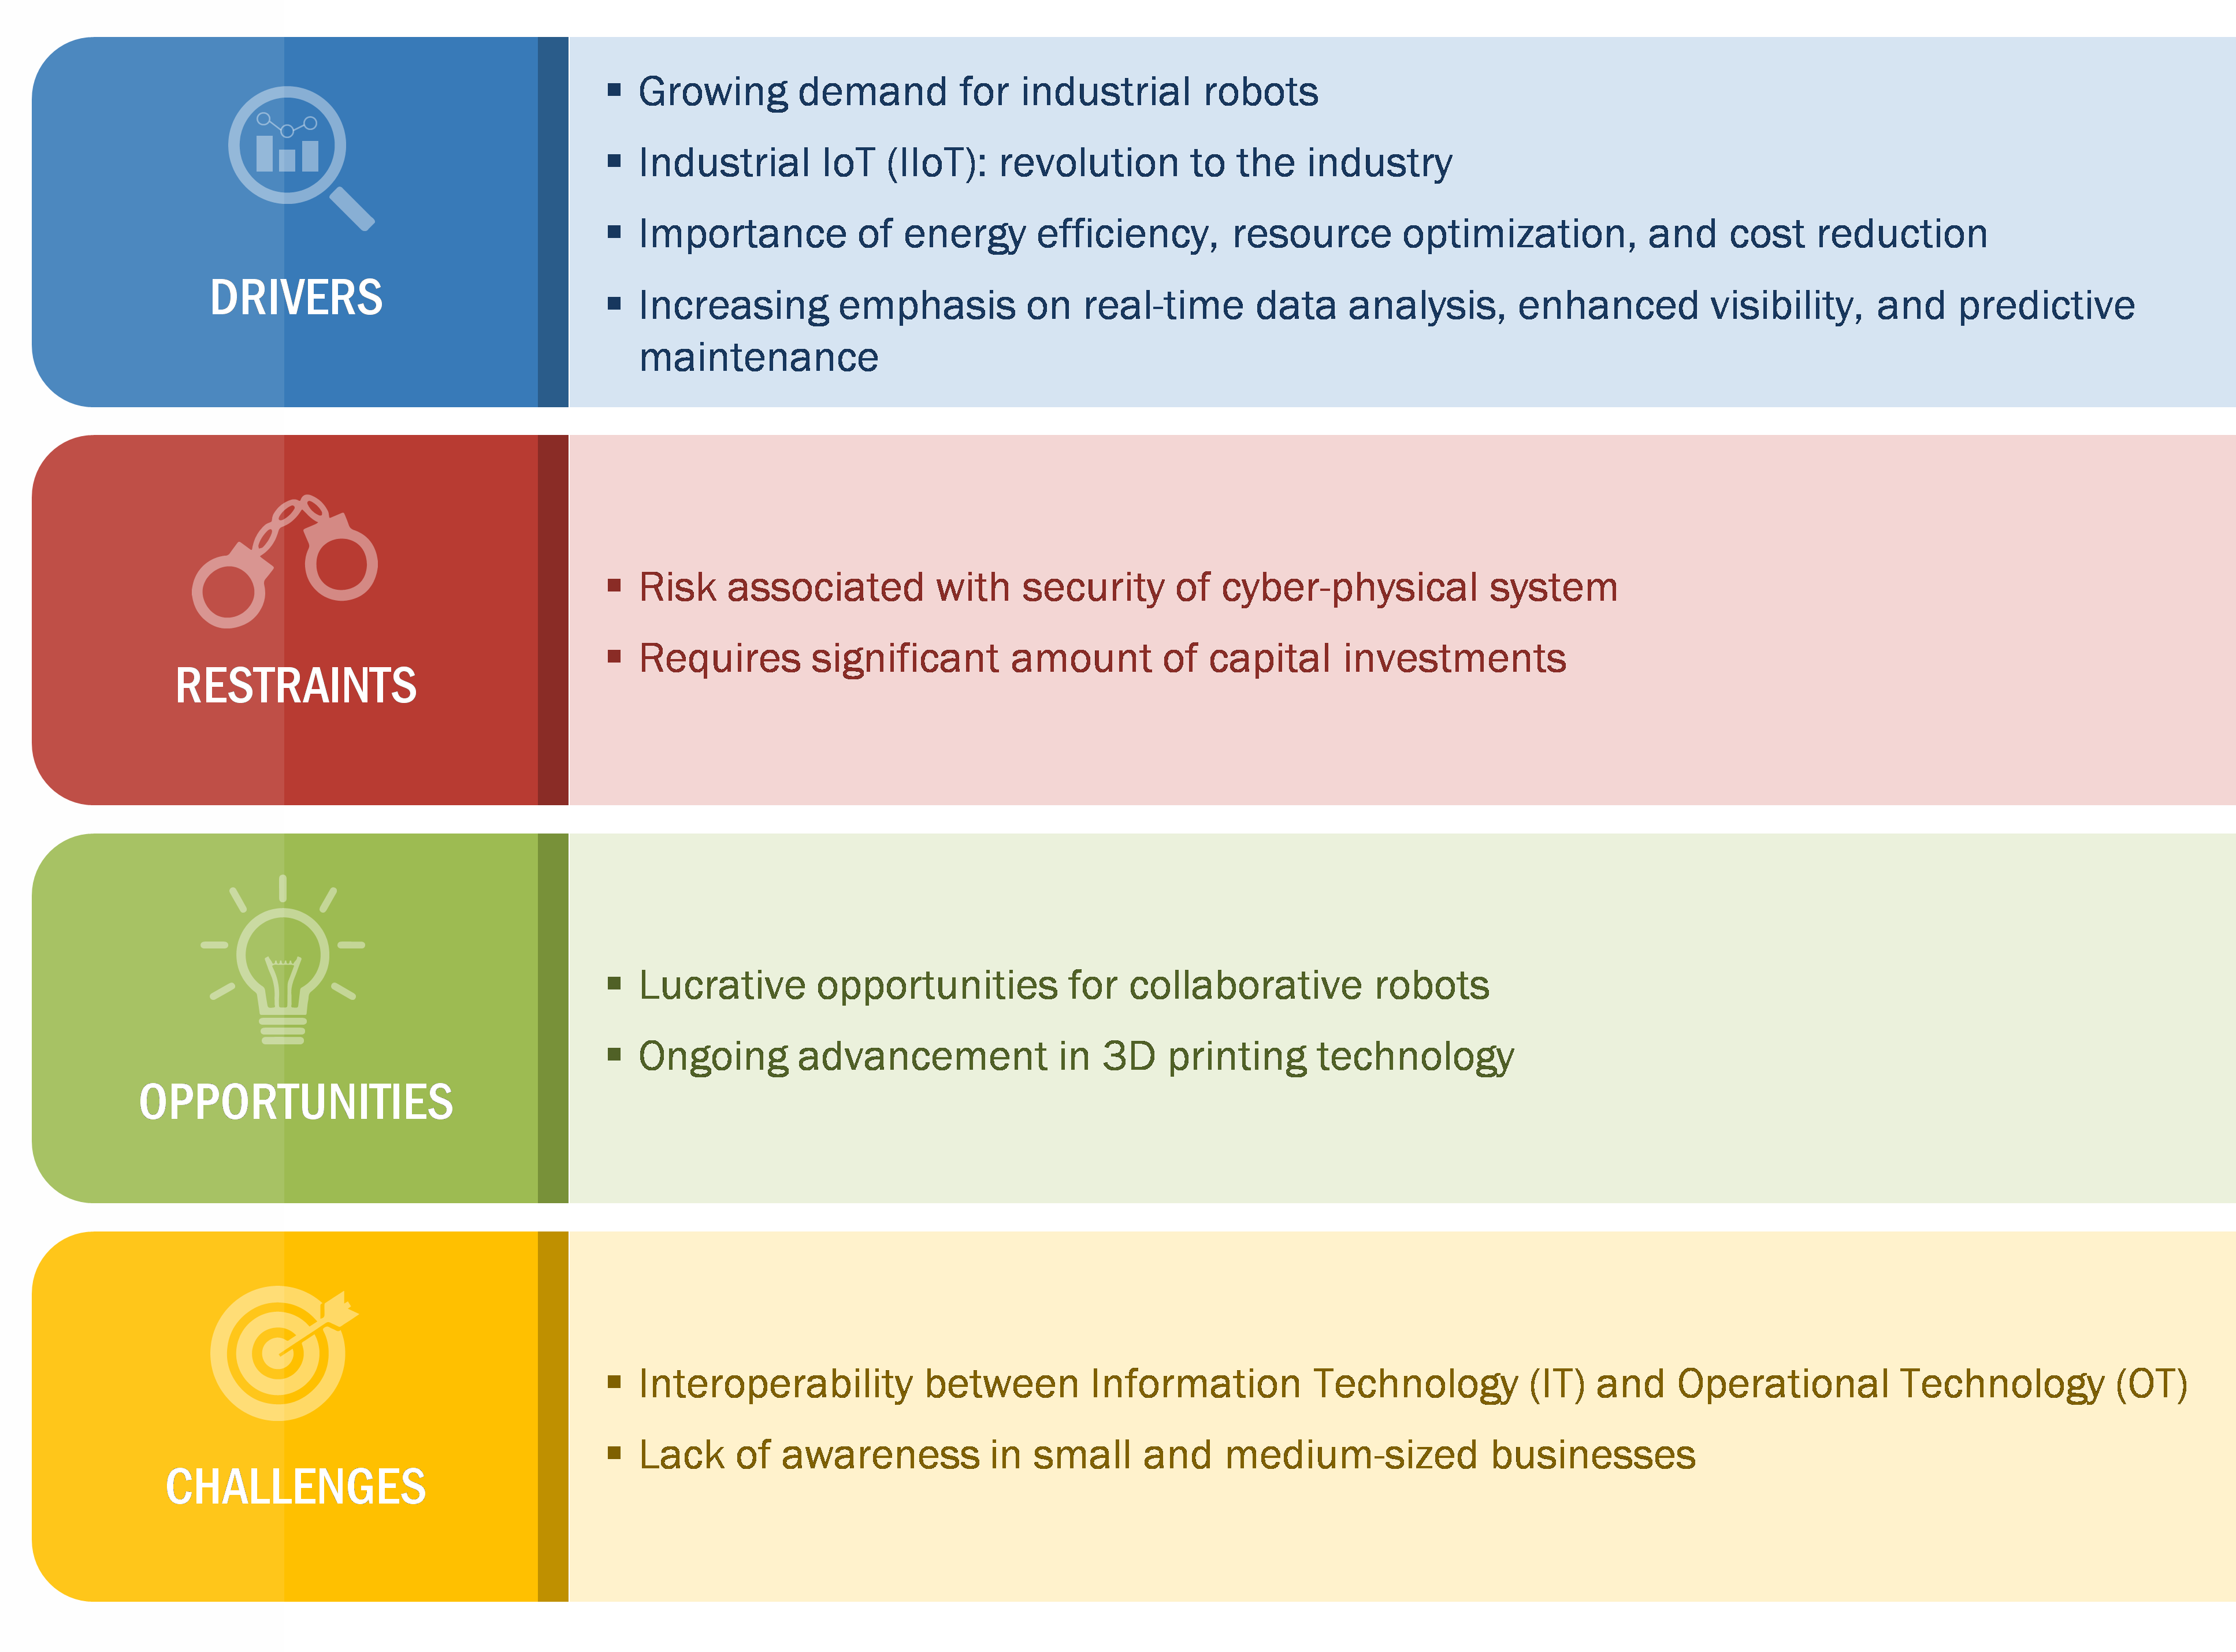
2.2.1.2 Industrial IoT (IIoT): Revolution to the Industry
Figure 2 IoT Transforming the Smart Factory Ecosystem
2.2.1.3 Importance of Energy Efficiency, Resource Optimization, and Cost Reduction
Figure 3 Industrial Annual Energy Cost Saving
2.2.1.4 Increasing Emphasis on Real-Time Data Analysis, Enhanced Visibility, and Predictive Maintenance
2.2.2 Restraints
2.2.2.1 Risk Associated With Security of Cyber-Physical System
2.2.2.2 Requirement of A Significant Amount of Capital Investments
2.2.3 Opportunities
2.2.3.1 Lucrative Opportunities for Collaborative Robots
Figure 4 Revenue Performance of Universal Robots
2.2.3.2 Ongoing Advancements in 3D Printing Technology
2.2.4 Challenges
2.2.4.1 Interoperability Between Information Technology (IT) and Operational Technology (OT)
2.2.4.2 Lack of Awareness in Small and Medium-Sized Businesses
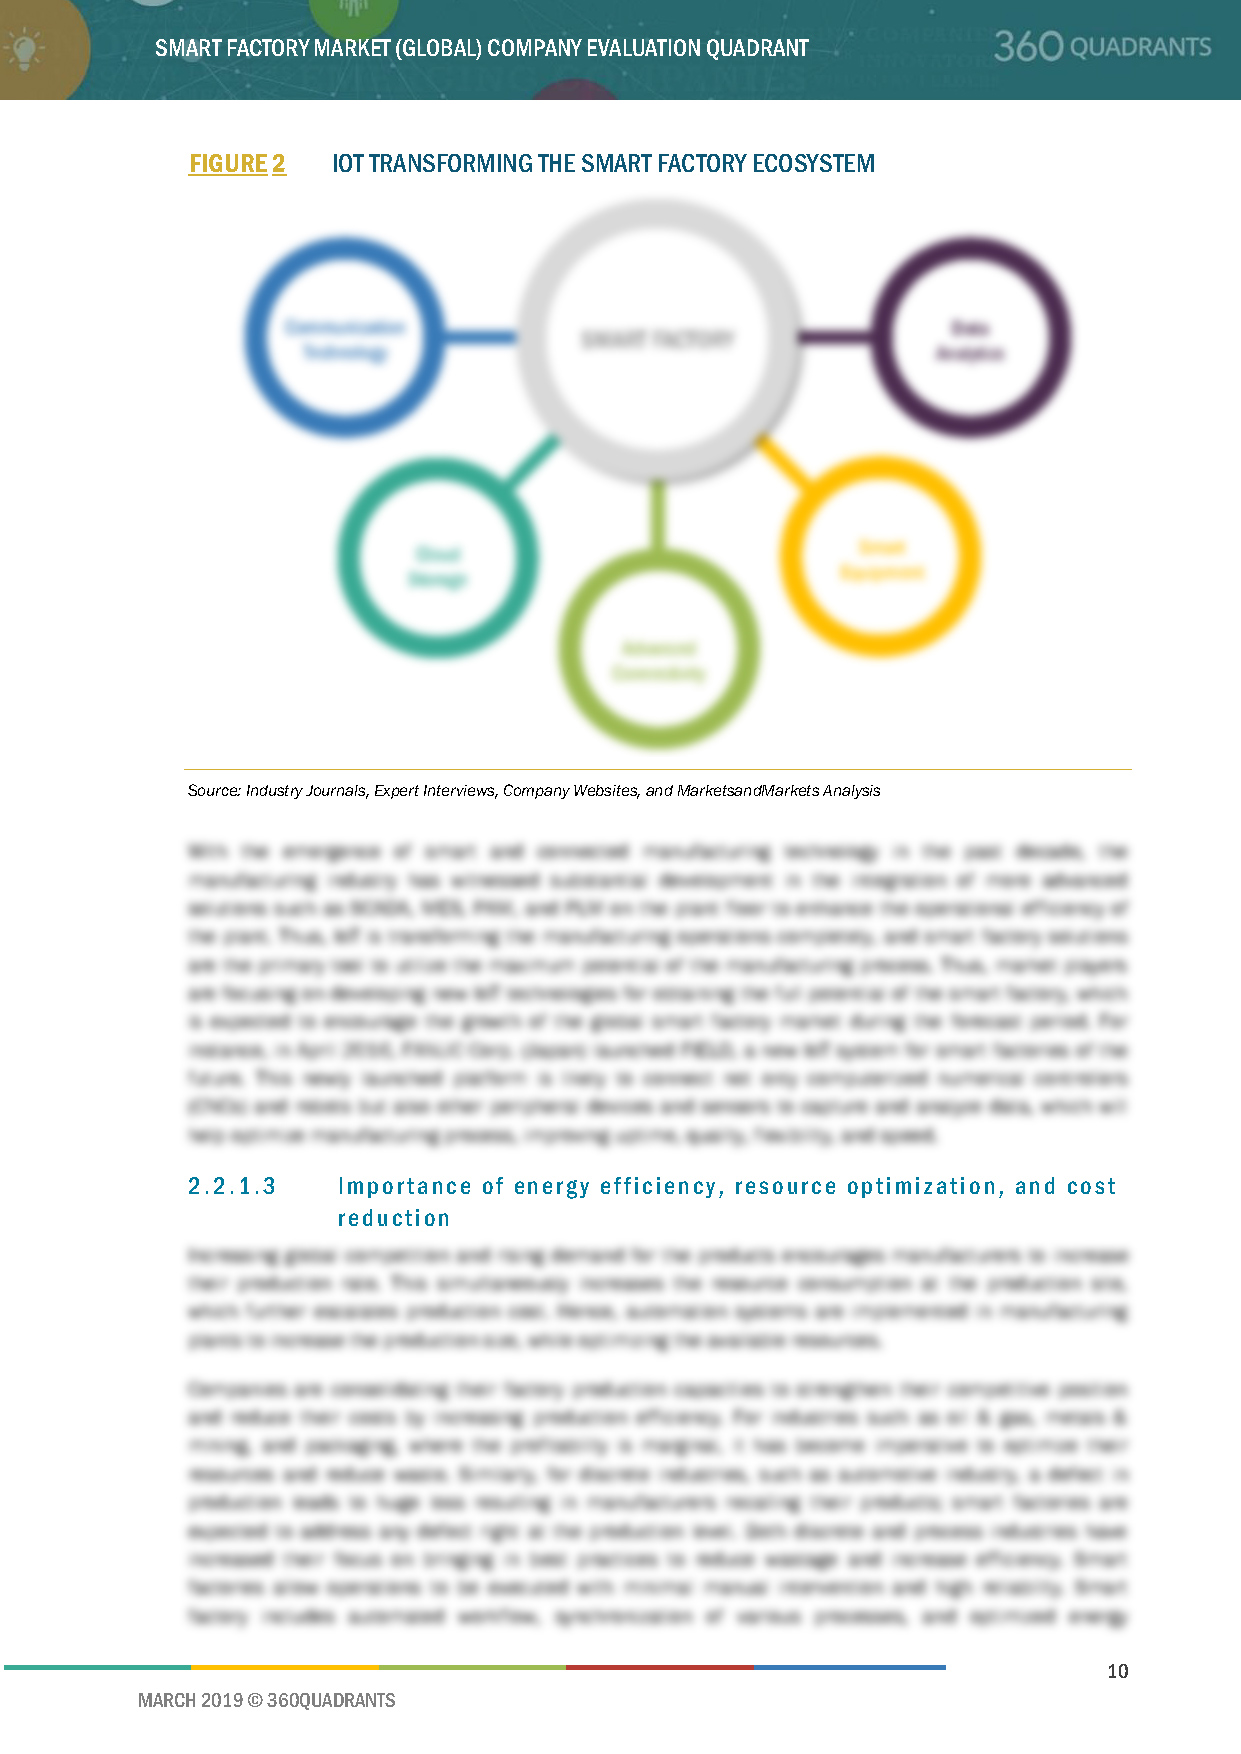
2.3 Enabling Technologies of Smart Factory Ecosystem
Figure 5 Key Enablers in Smart Factory Ecosystem
2.3.1 Artificial Intelligence
2.3.1.1 Importance of AI in Smart Factory
2.3.2 Augmented Reality (AR)
2.3.2.1 AR Enhancing the Smart Manufacturing Workforce
2.3.3 Big Data and Analytics
2.3.3.1 Big Data and Analytics: Crucial Industrial Communication
2.3.4 Blockchain
2.3.4.1 Connecting Blockchain and IoT
2.3.5 Industrial Cybersecurity
2.3.5.1 Defense for Smart Manufacturing
2.3.6 5G
Figure 6 Developments Due to 5G Network Evolution
2.3.6.1 5G Technology to Drive Smart Factory Market
Figure 7 Various Test Cases and Use Cases of 5G Technology
3 Company Evaluation Quadrant
3.1 Visionary Leaders
3.2 Dynamic Differentiators
3.3 Innovators
3.4 Emerging Companies
Figure 8 Smart Factory Market (Global), Company Evaluation Quadrant
4 Competitive Landscape
4.1 Overview
4.2 Competitive Analysis
4.2.1 Market Ranking Analysis: Smart Factory Market, 2017
Figure 9 Market Ranking of the Top 5 Players in the Smart Factory Market, 2017
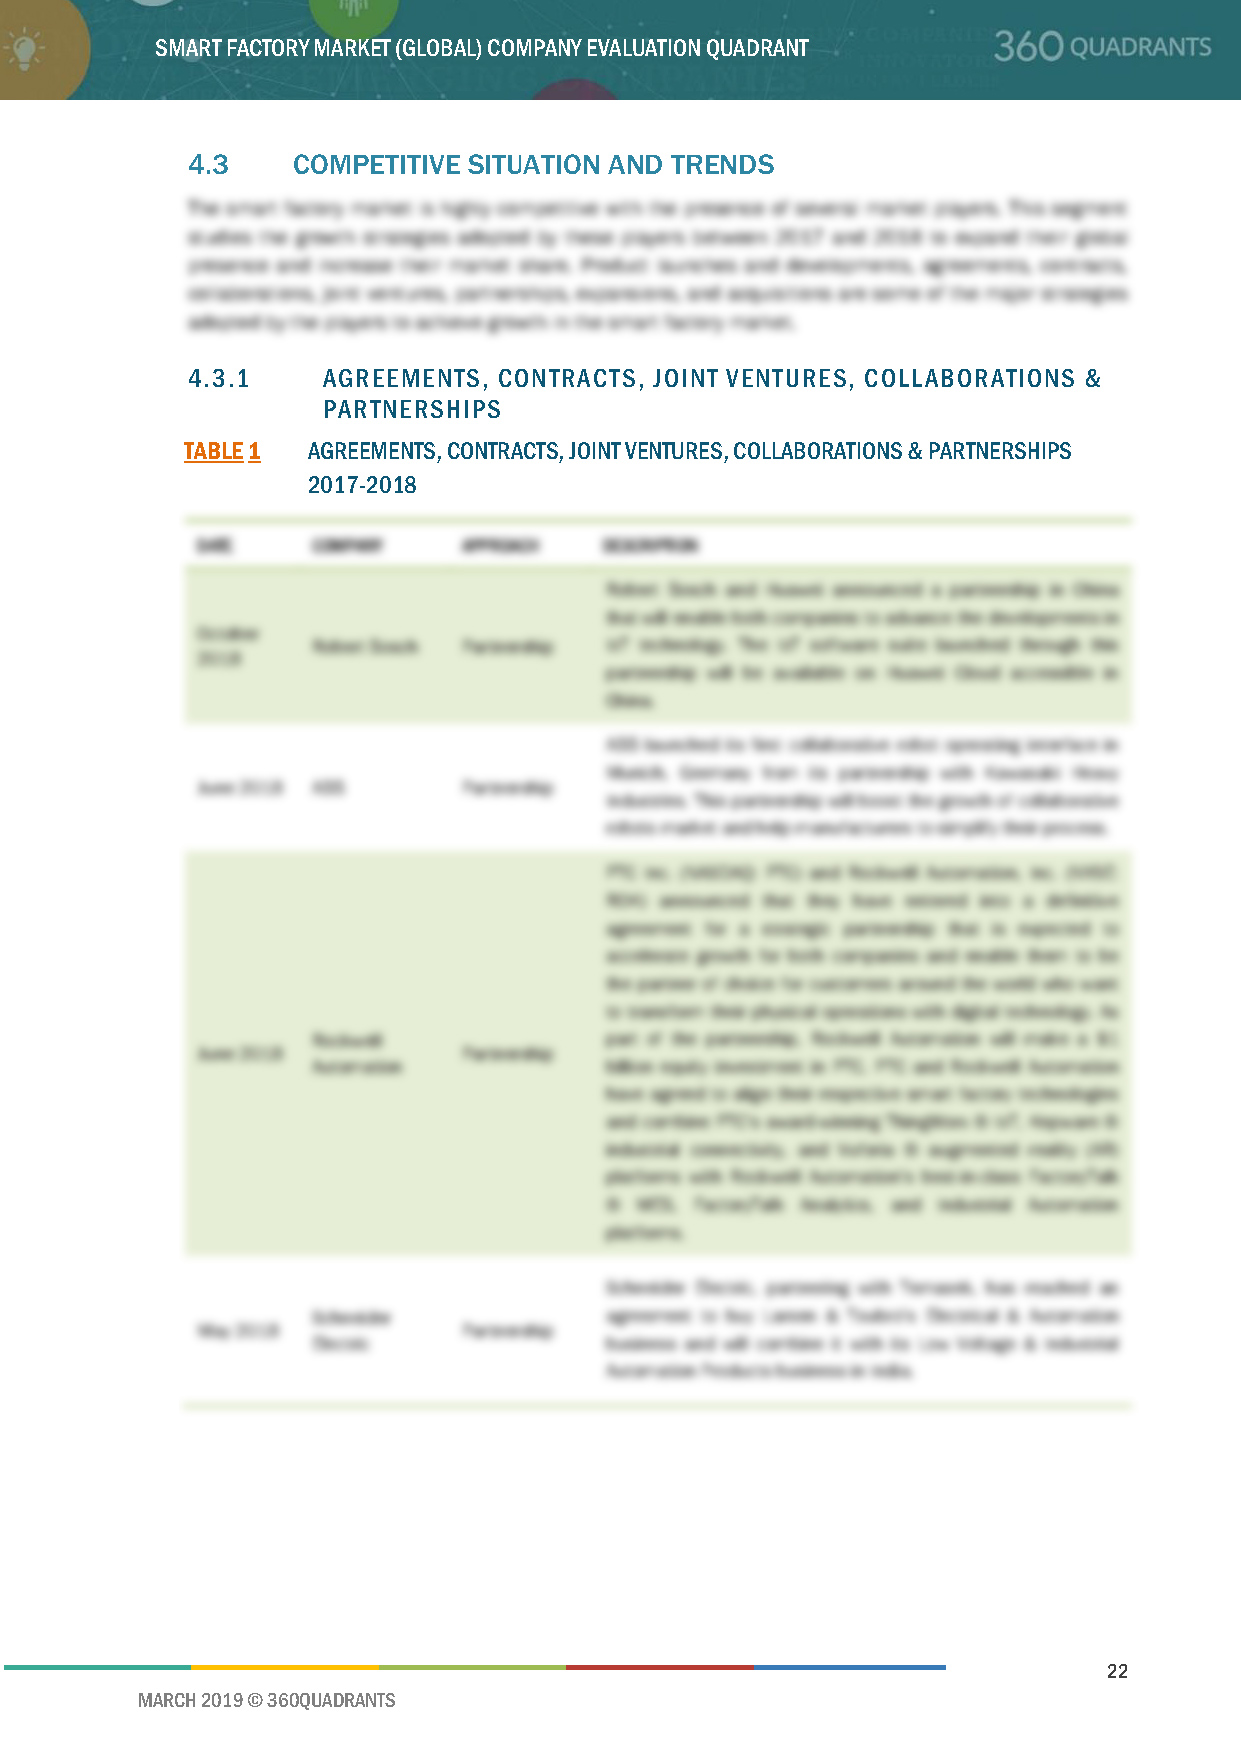
4.3 Competitive Situation and Trends
4.3.1 Agreements, Contracts, Joint Ventures, Collaborations & Partnerships
Table 1 Agreements, Contracts, Joint Ventures, Collaborations & Partnerships 2017-2018
4.3.2 Product Launches and Developments
Table 2 Product Launches and Developments 2017-2018
4.3.3 Acquisitions and Expansions
Table 3 Acquisitions and Expansions 2017-2018
5 Company Profiles
5.1 Key Players
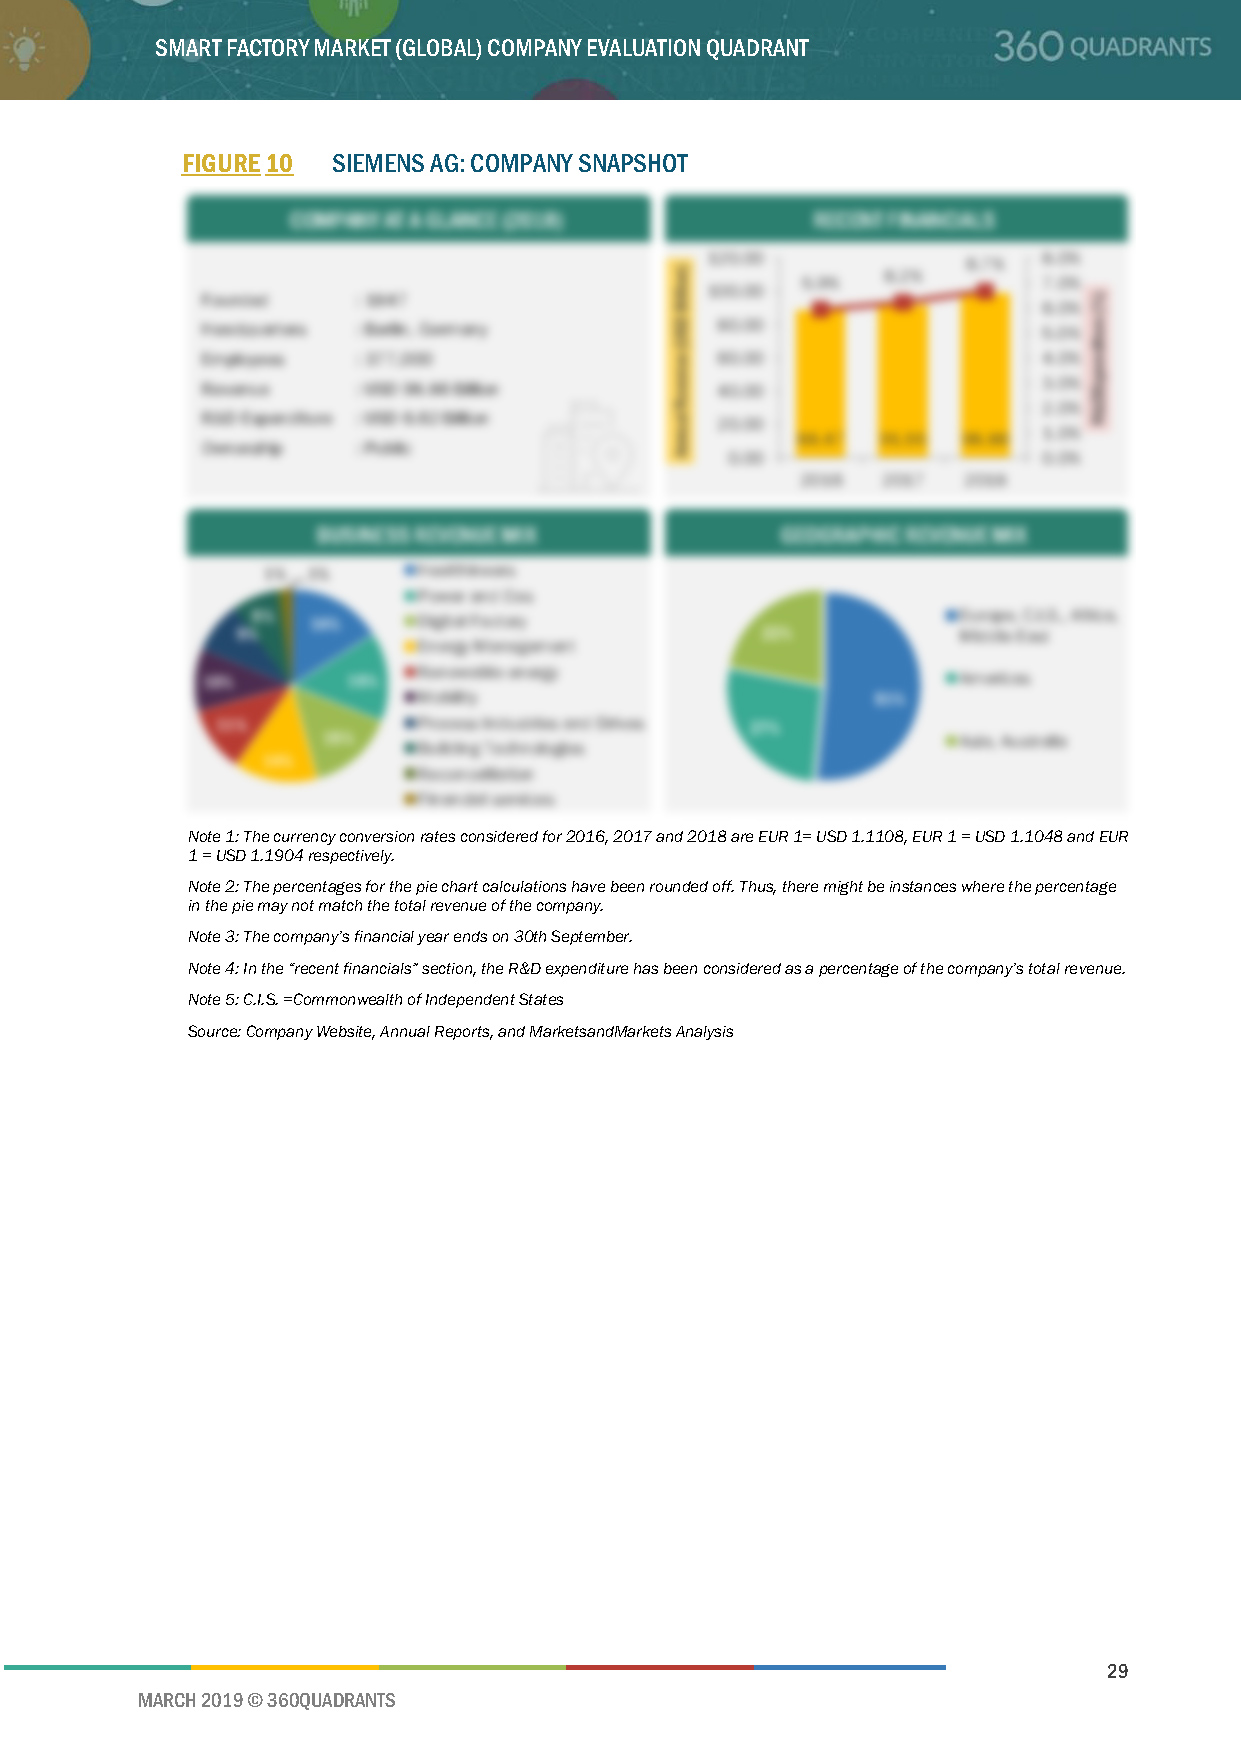
5.1.1 Siemens
5.1.1.1 Business Overview*
Figure 10 Siemens AG: Company Snapshot
5.1.1.2 Products Offered*
5.1.1.3 Recent Developments*
5.1.1.4 SWOT Analysis*
5.1.1.5 MnM View*
(*Above sections are present for all of below companies)
5.1.2 General Electric
Figure 11 General Electric: Company Snapshot
5.1.3 ABB
Figure 12 ABB Ltd.: Company Snapshot
5.1.4 Rockwell Automation
Figure 13 Rockwell Automation: Company Snapshot
5.1.5 Schneider Electric
Figure 14 Schneider Electric: Company Snapshot
5.1.6 Honeywell International
Figure 15 Honeywell International: Company Snapshot
5.1.7 FANUC
Figure 16 FANUC: Company Snapshot
5.1.8 Mitsubishi Electric
Figure 17 Mitsubishi Electric: Company Snapshot
5.1.9 Emerson Electric
Figure 18 Emerson Electric: Company Snapshot
5.1.10 Yokogawa Electric
Figure 19 Yokogawa Electric Corporation: Company Snapshot
5.1.11 Robert Bosch
Figure 20 Robert Bosch: Company Snapshot
5.1.12 Stratasys
Figure 21 Stratasys: Company Snapshot
6 Appendix
6.1 Other Significant Players
6.1.1 TE Connectivity
6.1.2 Texas Instruments
6.1.3 HP
6.1.4 KUKA
6.1.5 SAP
6.1.6 Omron
6.1.7 Dassault Systemes
6.1.8 Qualcomm
6.2 Methodology
This report identifies and benchmarks the best smart factory solution providers such as Siemens, General Electric, ABB, Honeywell International, Rockwell Automation, and evaluates them on the basis of business strategy excellence and strength of product portfolio within the Smart Factory ecosystem, combining inputs from various industry experts, buyers, and vendors, and extensive secondary research including annual reports, company press releases, investor presentations, free and paid company databases. They are rated and positioned on 2x2 matrix, called as ‘Company Evaluation Quadrant’, and identified as Visionary Leaders, Dynamic Differentiators, Innovators, or Emerging companies.
SAMPLES:
Personalize Your Research Requirement
- Updated version of this Quadrant
- Different Company Evaluation Quadrant
- 'Startup Only' Company Evaluation Quadrant
- Region or Country specific evaluation
- Application or Industry specific evaluation ..Read More
Analyst Briefing & Inquiry
- Submit a Briefing Request
- Question about our published research
- Request for evaluation of your organization for specific market
- Request for re-evaluation of Company Evaluation Quadrant ..Read More