
Smart Lighting Quadrant Report
Smart Lighting Market (Global) Company Evaluation Quadrant
Published on
Feb'2020
Pages
78
Code
360-SE 2506
Smart lighting refers to the lighting systems in an environment that are controlled by network-driven control systems. Lighting control systems deliver the right amount of light at the right place and at the right time. Smart lighting is designed with the intention of improving energy efficiency. Other advantages of smart lighting include cost savings in the long run and overall power savings.
The smart lighting market is estimated to grow to USD 31 billion by 2025, at a CAGR of 18.0%. The most significant factor driving the growth of this market is the requirement of energy-efficient connected lighting controls. This requirement is due to the increased awareness towards reducing energy consumption. The advent of integrated lighting control systems, upcoming smart city projects in developing economies, increasing adoption and decreasing cost of LEDs, integration of lighting solutions with smart devices, and growing awareness about energy savings among consumers and governments worldwide are the major factors contributing to the growth of the smart lighting market.
Integration of lighting solutions with smart devices is driving the growth in the Smart Lighting Market
This report identifies and benchmarks the best Smart Lighting manufacturers such as Signify (Philips Lighting) (Netherlands), Legrand S.A. (France), Acuity Brands, Inc. (US), Eaton Corporation (Ireland) and General Electric Company (US), and evaluates them on the basis of business strategy excellence and strength of product portfolio within the Smart Lighting ecosystem, combining inputs from various industry experts, buyers, and vendors, and extensive secondary research including annual reports, company press releases, investor presentations, free and paid company databases. Best Smart Lighting manufacturers are rated and positioned on a 2x2 matrix, called ‘Company Evaluation Quadrant’, and identified as Visionary Leaders, Dynamic Differentiators, Innovators, or Emerging companies.
The report includes market-specific company profiles of all 25 players and assesses the recent developments that shape the competitive landscape of this highly fragmented market.
List of top Smart Lighting companies evaluated and profiled in the report:
- ABB
- ACUITY BRANDS, INC.
- ADESTO TECHNOLOGIES (ECHELON CORPORATION)
- DIALIGHT PLC
- EATON CORPORATION PLC
- ENLIGHTED INC. (A SIEMENS COMPANY)
- GENERAL ELECTRIC COMPANY (CURRENT-POWERED BY GE)
- HELVAR
- HONEYWELL INTERNATIONAL INC.
- HUBBELL INCORPORATED
- IDEAL INDUSTRIES, INC. (CREE LIGHTING)
- LEGRAND S.A.
- LEVITON MANUFACTURING COMPANY, INC.
- LG ELECTRONICS INC.
- LIGHTWAVERF PLC
- LUTRON ELECTRONICS CO., INC.
- OSRAM LICHT AG
- PANASONIC GROUP
- RAB LIGHTING INC.
- SCHNEIDER ELECTRIC SE
- SIGNIFY N.V. (PHILIPS LIGHTING N.V.)
- SYNAPSE WIRELESS, INC. (MCWANE, INC.)
- SYSKA LED
- WIPRO ENTERPRISES (P) LIMITED
- ZUMTOBEL GROUP AG
Table of Contents
1 Introduction
1.1 Market Definition
2 Market Overview
2.1 Introduction
2.2 Market Dynamics
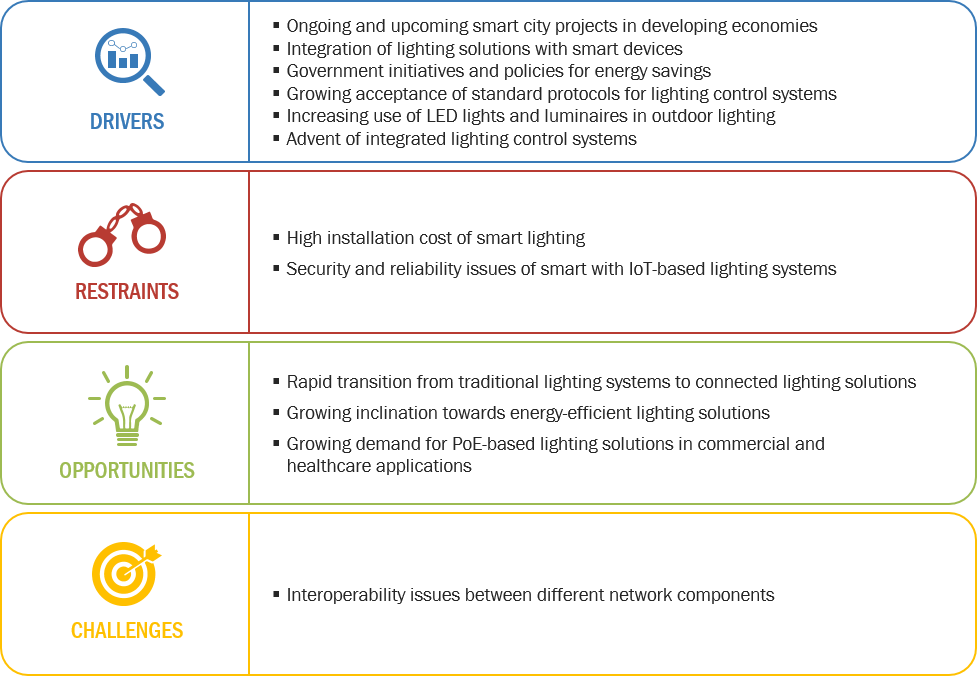
Figure 1 Smart Lighting Market: Drivers, Restraints, Opportunities, and Challenges
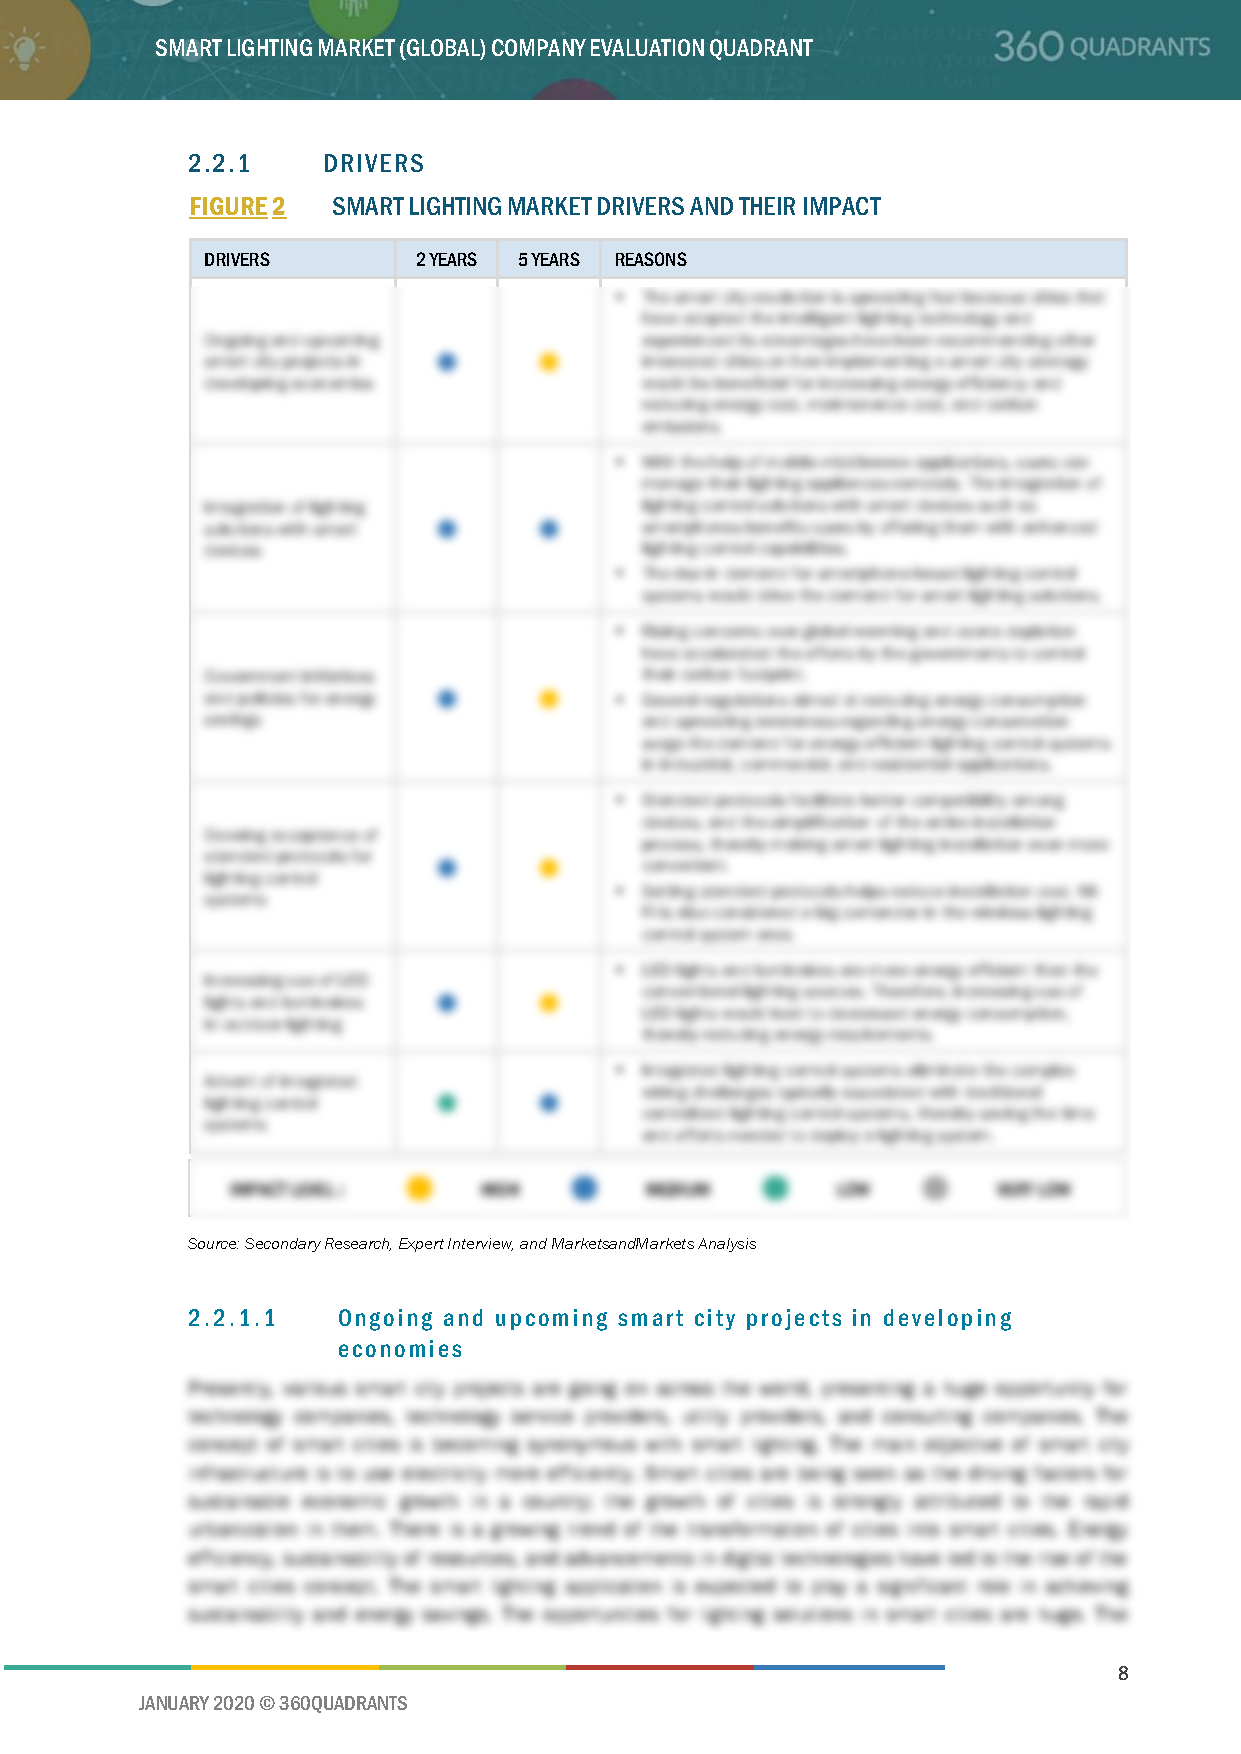
2.2.1 Drivers
Figure 2 Smart Lighting Market Drivers and Their Impact
2.2.1.1 Ongoing and Upcoming Smart City Projects in Developing Economies
2.2.1.2 Integration of Lighting Solutions With Smart Devices
2.2.1.3 Government Initiatives and Policies for Energy Savings
2.2.1.4 Growing Acceptance of Standard Protocols for Lighting Control Systems
2.2.1.5 Increasing Use of Led Lights and Luminaires in Outdoor Lighting
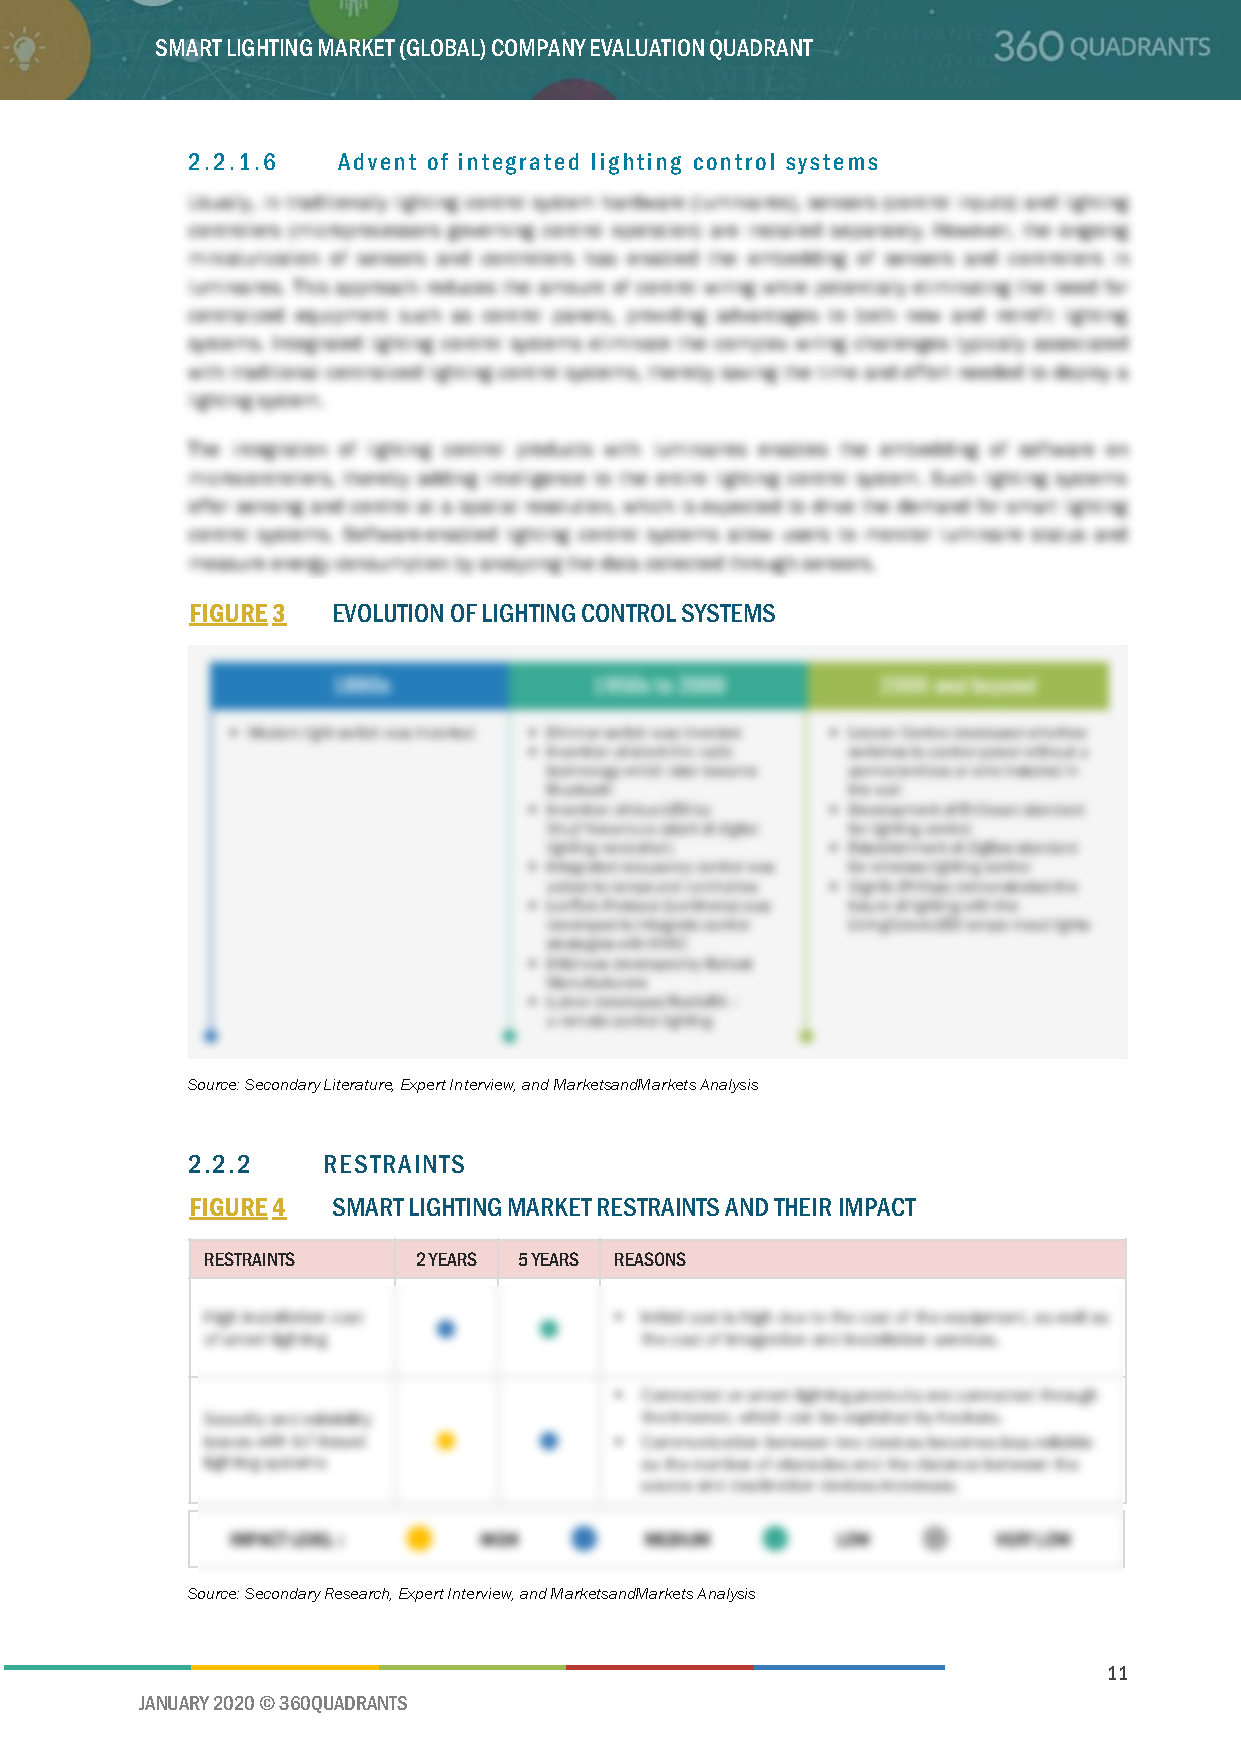
2.2.1.6 Advent of Integrated Lighting Control Systems
Figure 3 Evolution of Lighting Control Systems
2.2.2 Restraints
Figure 4 Smart Lighting Market Restraints and Their Impact
2.2.2.1 High Installation Cost of Smart Lighting
2.2.2.2 Security and Reliability Issues With IoT-Based Lighting Systems
2.2.3 Opportunities
Figure 5 Smart Lighting Market Opportunities and Their Impact
2.2.3.1 Rapid Transition From Traditional Lighting to Connected Lighting Solutions
2.2.3.2 Growing Inclination Toward Energy-Efficient Lighting Solutions
2.2.3.3 Growing Demand for Poe-Based Lighting Solutions in Commercial and Healthcare Applications
2.2.4 Challenges
Figure 6 Smart Lighting Market Challenges and Their Impact
2.2.4.1 Interoperability Issues Between Different Network Components
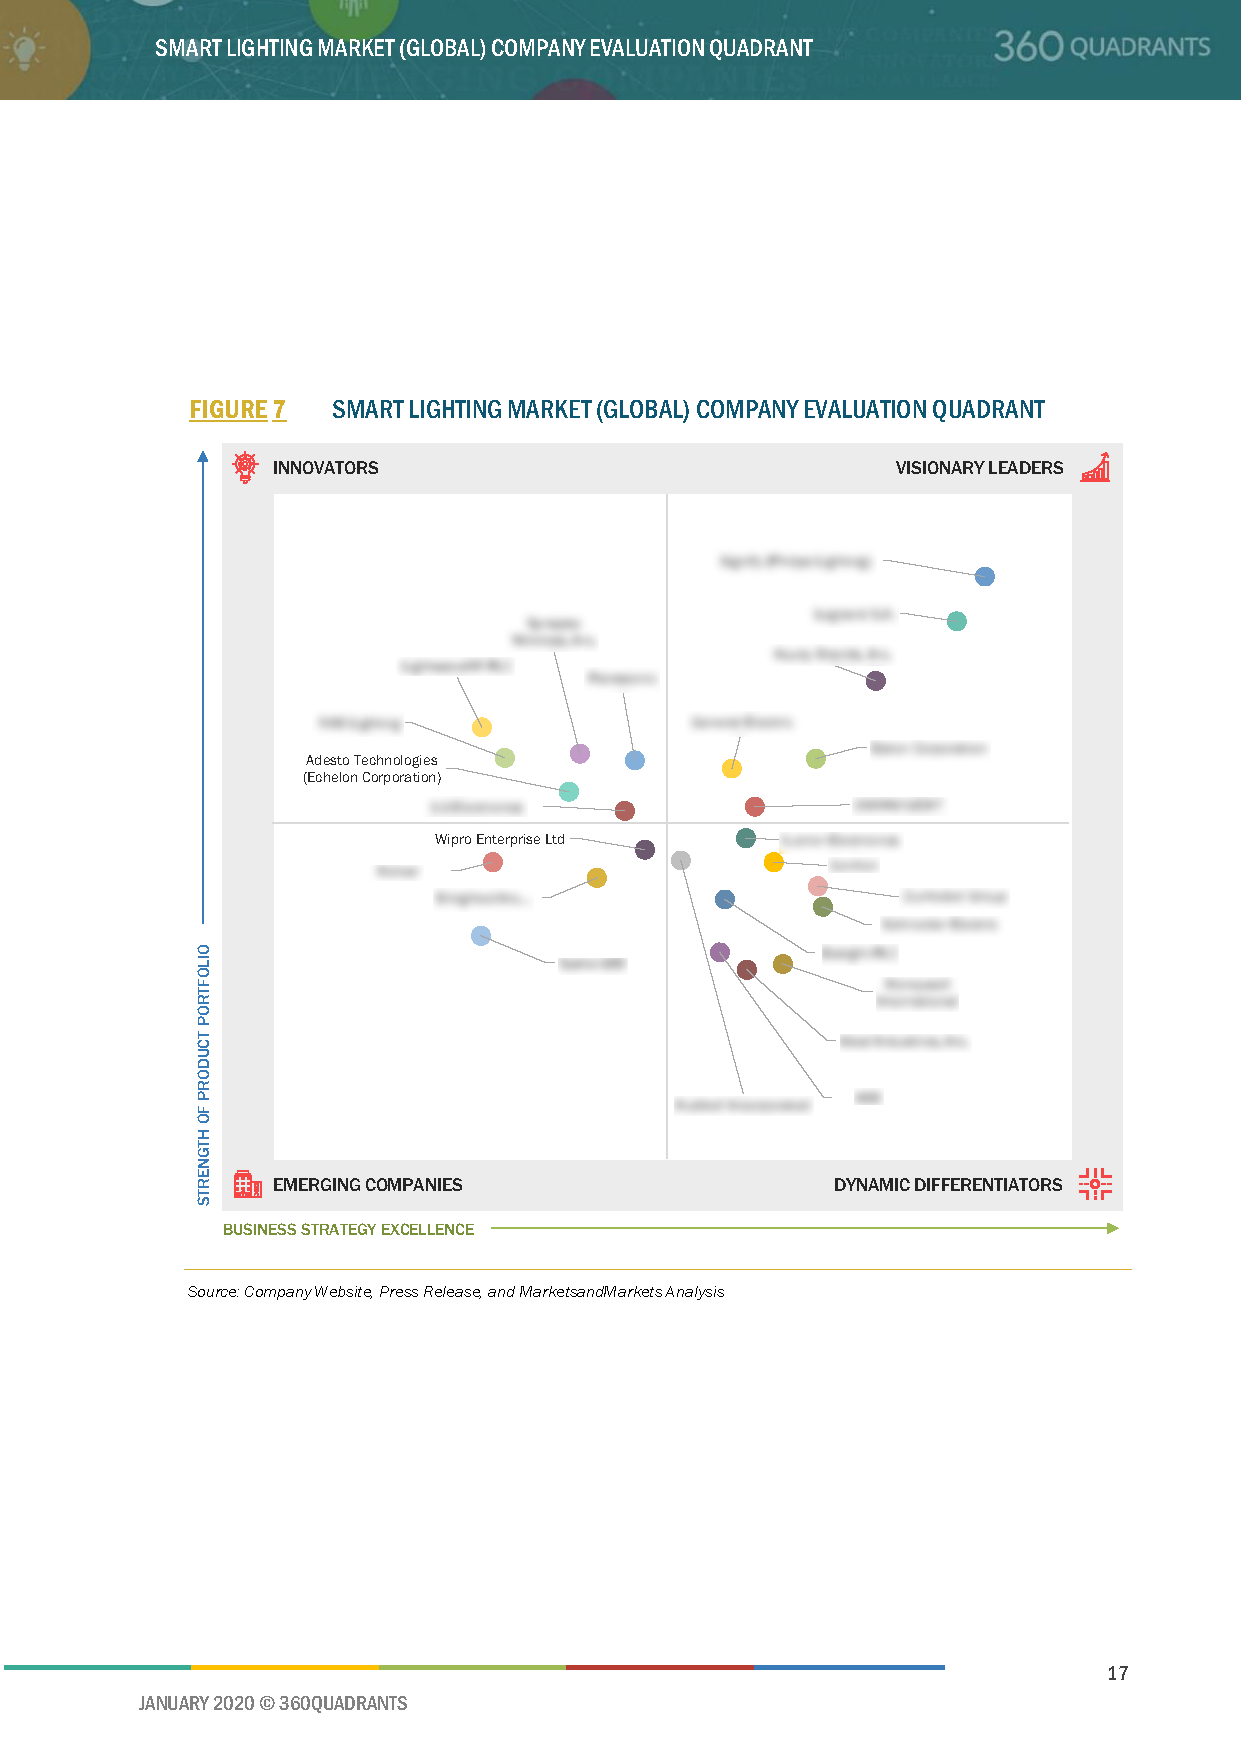
3 Company Evaluation Quadrant
3.1 Visionary Leaders
3.2 Innovators
3.3 Dynamic Differentiators
3.4 Emerging Companies
Figure 7 Smart Lighting Market (Global) Company Evaluation Quadrant
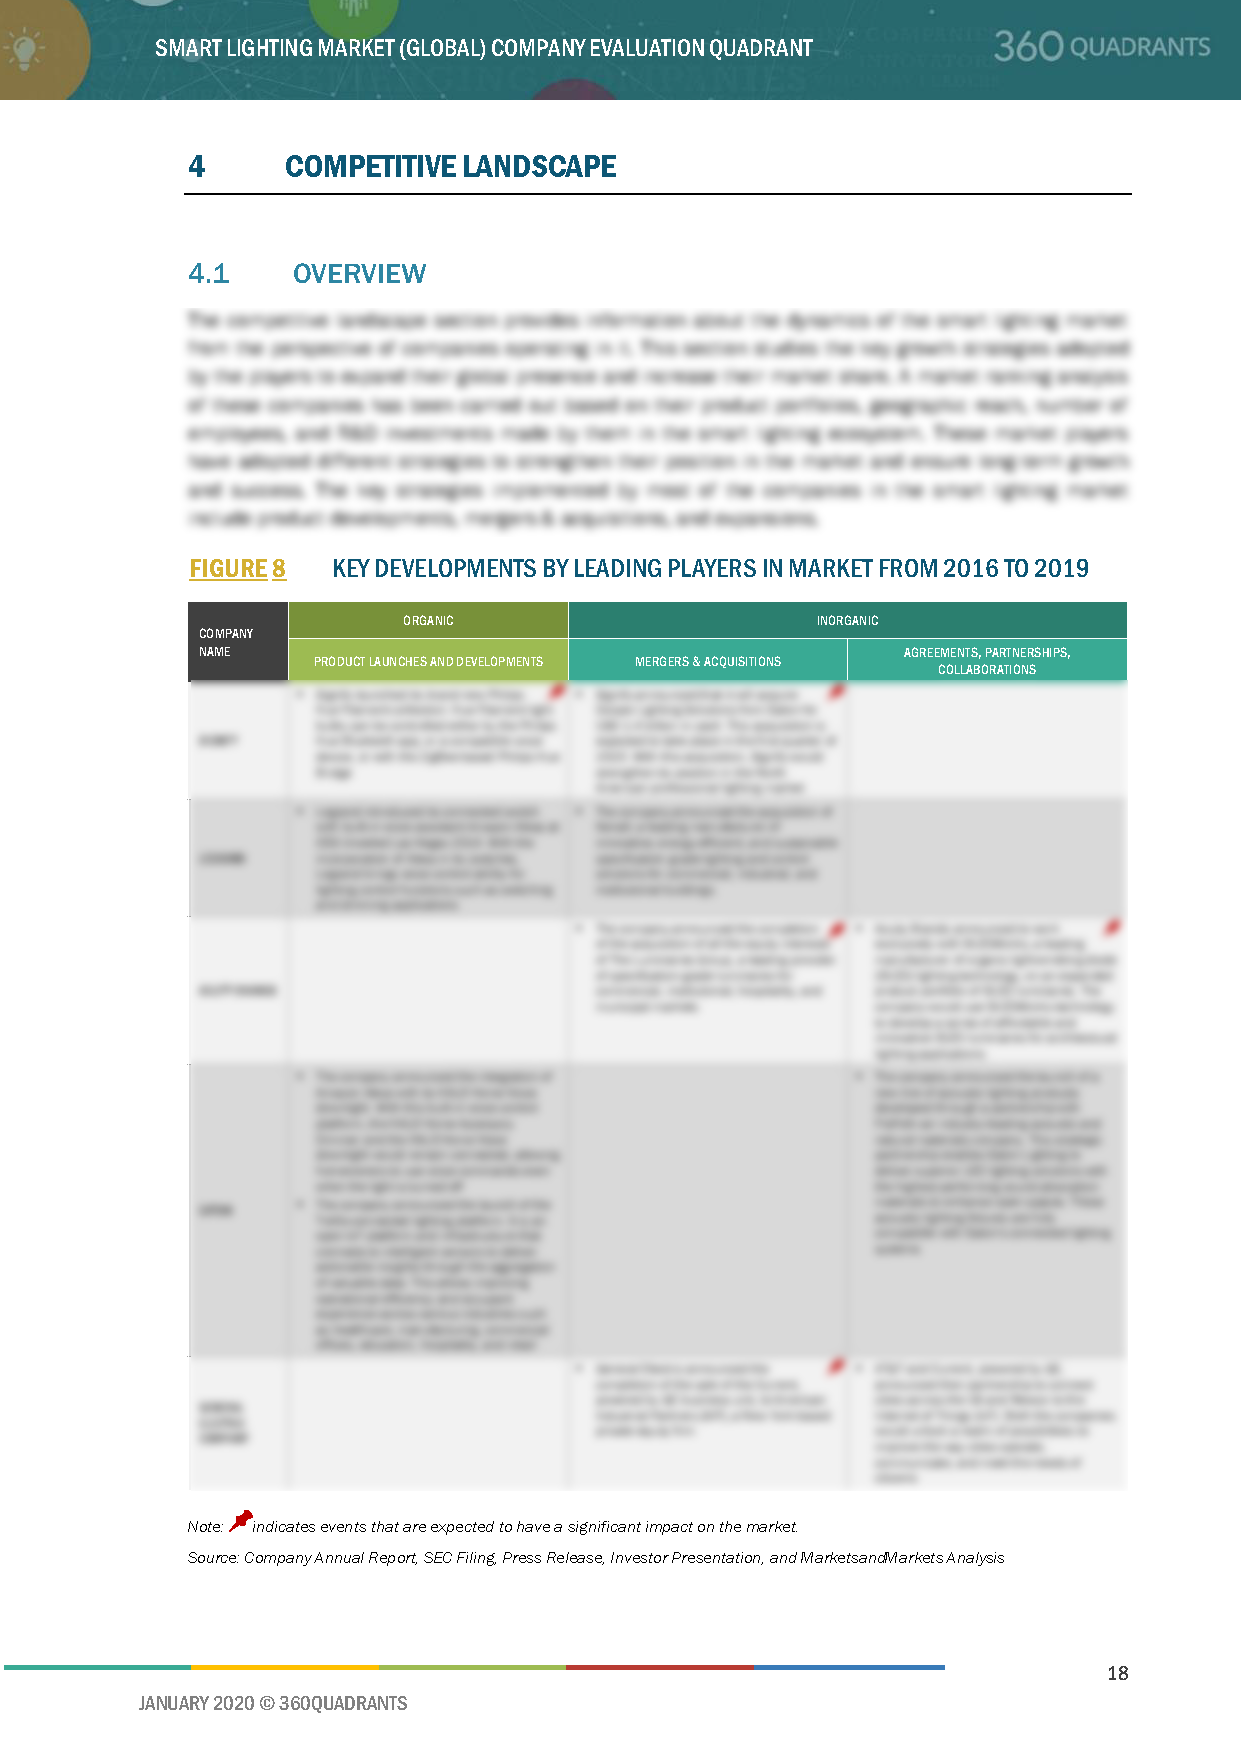
4 Competitive Landscape
4.1 Overview
Figure 8 Key Developments By Leading Players in Market From 2016 to 2019
4.2 Market Ranking Analysis, 2019
Figure 9 Market Ranking of Top 5 Players in Smart Lighting Market, 2019
4.3 Competitive Situations and Trends
4.3.1 Product Launches, Demonstrations, and Developments
Table 1 Product Launches, Demonstrations, and Developments, 2019
4.3.2 Agreements, Partnerships, Collaborations, Contracts, Funding, and Joint Ventures
Table 2 Agreements, Partnerships, Collaborations, Contracts, Funding, and Joint Ventures, 2019
4.3.3 Mergers & Acquisitions
Table 3 Mergers & Acquisitions, 2019
4.4 Right to Win (Company Business Snapshot)
5 Company Profiles
5.1 Introduction
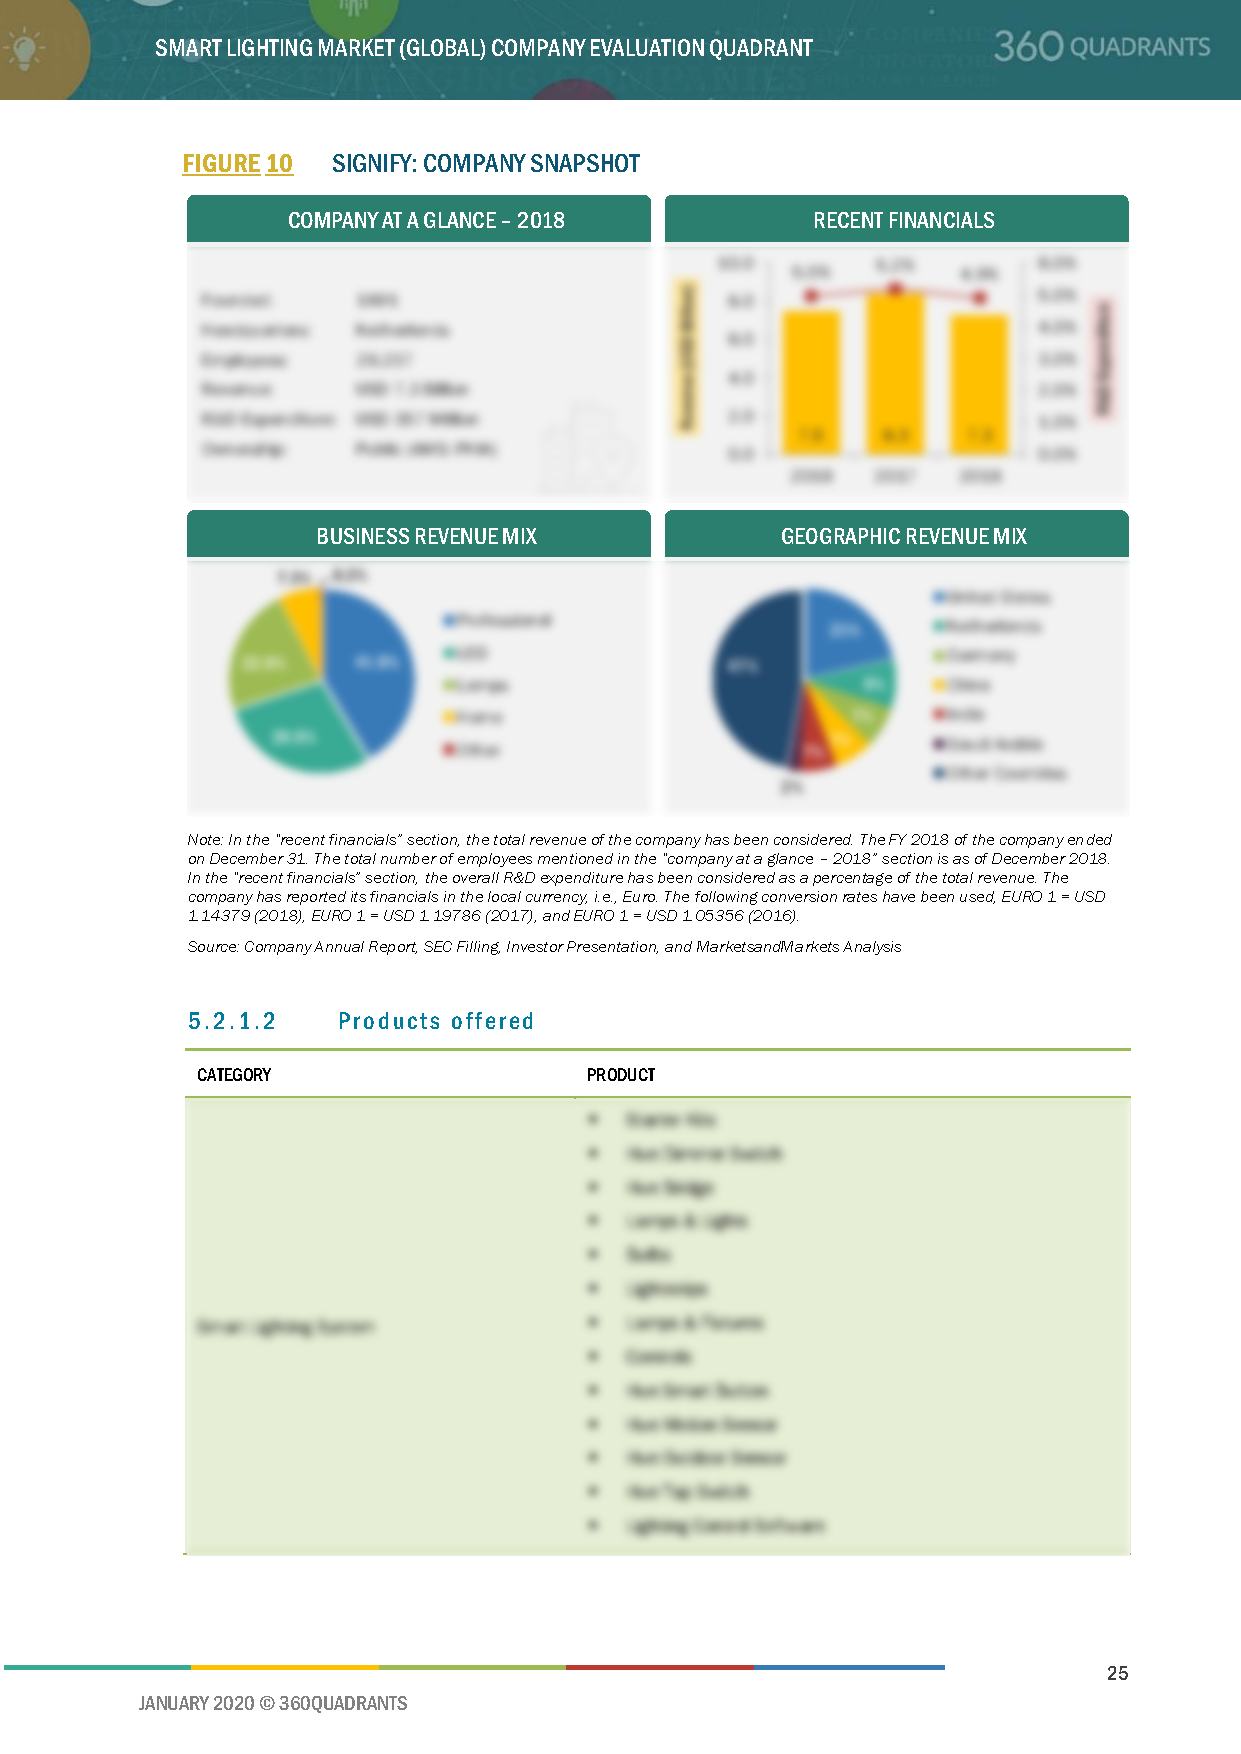
5.2 Signify N.V. (Philips Lighting N.V.)
5.2.1 Business Overview*
Figure 10 Signify: Company Snapshot
5.2.2 Products Offered*
5.2.3 Recent Developments*
5.2.4 SWOT Analysis*
5.2.5 MnM View*
(*Above sections are present for all of below companies)
5.3 Legrand S.A.
Figure 11 Legrand: Company Snapshot
5.4 Acuity Brands, Inc.
Figure 12 Acuity Brands: Company Snapshot
5.5 Eaton Corporation PLC
Figure 13 Eaton Corporation PLC: Company Snapshot
5.6 General Electric Company (Current-Powered By GE)
Figure 14 General Electric Company: Company Snapshot
5.7 OSRAM Licht AG
Figure 15 OSRAM Licht AG: Company Snapshot
5.8 Leviton Manufacturing Company, Inc.
5.9 Lutron Electronics Co., Inc.
5.10 Honeywell International Inc.
Figure 16 Honeywell International Inc: Company Snapshot
5.11 Hubbell Incorporated
Figure 17 Hubbell Incorporated: Company Snapshot
5.12 Zumtobel Group AG
Figure 18 Zumtobel Group AG: Company Snapshot
6 Appendix
6.1 Other Significant Players
6.1.1 Dialight PLC
6.1.2 Schneider Electric SE
6.1.3 ABB
6.1.4 Ideal Industries, Inc. (Cree Lighting)
6.1.5 LightwaveRF PLC
6.1.6 RAB Lighting Inc.
6.1.7 Synapse Wireless, Inc. (McWane, Inc.)
6.1.8 Panasonic Group
6.1.9 Adesto Technologies (Echelon Corporation)
6.1.10 LG Electronics Inc.
6.1.11 Wipro Enterprises (P) Limited
6.1.12 Syska LED
6.1.13 Enlighted Inc. (A Siemens Company)
6.1.14 Helvar
6.2 Methodology
This report identifies and benchmarks the best Smart Lighting manufacturers such as Signify (Philips Lighting) (Netherlands), Legrand S.A. (France), Acuity Brands, Inc. (US), Eaton Corporation (Ireland) and General Electric Company (US), and evaluates them on the basis of business strategy excellence and strength of product portfolio within the Smart Lighting ecosystem, combining inputs from various industry experts, buyers, and vendors, and extensive secondary research including annual reports, company press releases, investor presentations, free and paid company databases. They are rated and positioned on 2x2 matrix, called as ‘Company Evaluation Quadrant’, and identified as Visionary Leaders, Dynamic Differentiators, Innovators, or Emerging companies.
SAMPLES:
Personalize Your Research Requirement
- Updated version of this Quadrant
- Different Company Evaluation Quadrant
- 'Startup Only' Company Evaluation Quadrant
- Region or Country specific evaluation
- Application or Industry specific evaluation ..Read More
Analyst Briefing & Inquiry
- Submit a Briefing Request
- Question about our published research
- Request for evaluation of your organization for specific market
- Request for re-evaluation of Company Evaluation Quadrant ..Read More