
Best Sports Technology Vendors In 2026
Sports Technology Market (Global) Company Evaluation Quadrant
Published on
Mar'2019
Pages
105
Code
360-SE 7011
The global acceptance in wearable equipment by athletes in various sports combined with sports data analytics, smart stadium, esports, and devices including wearable devices, digital signage, and cameras broadly constitute the sports technology market. The sports technology market is projected to reach USD 31.05 billion by 2024. Major factors driving the growth of the sports technology market include significant improvement in audience engagement, growing demand for data-driven decisions and operations, and increasing sports events online and offline.
SIGNIFICANT IMPROVEMENT IN AUDIENCE ENGAGEMENT DRIVING TO DRIVE THE GROWTH OF THE SPORTS TECHNOLOGY MARKET
This report identifies and benchmarks the key market players in the Sports Technology market such as IBM (US), Ericsson (Sweden), Cisco (US), Fujitsu (Japan), and SAP (Germany) and evaluates them based on business strategy excellence and strength of product portfolio within the Sports Technology ecosystem, combining inputs from various industry experts, buyers, and vendors, and extensive secondary research including annual reports, company press releases, investor presentations, free and paid company databases. They are rated and positioned on a 2x2 matrix, called as ‘Company Evaluation Quadrant,’ and identified as Visionary Leaders, Dynamic Differentiators, Innovators, or Emerging companies.
The report includes market-specific company profiles of all 25 players and assesses the recent developments that shape the competitive landscape of this highly fragmented market.
List of companies evaluated and profiled in the report:
- ACTIVISION BLIZZARD
- APPLE
- CISCO
- CJ CORPORATION
- ERICSSON
- FITBIT
- FUJITSU
- GARMIN
- IBM
- LG
- MODERN TIMES GROUP
- NEC
- ORACLE
- PANASONIC
- SAMSUNG
- SAP
- SHARP
- SONY
- TENCENT
Table of Contents
1 Introduction
1.1 Market Definition
2 Market Overview
2.1 Introduction
2.2 Market Dynamics
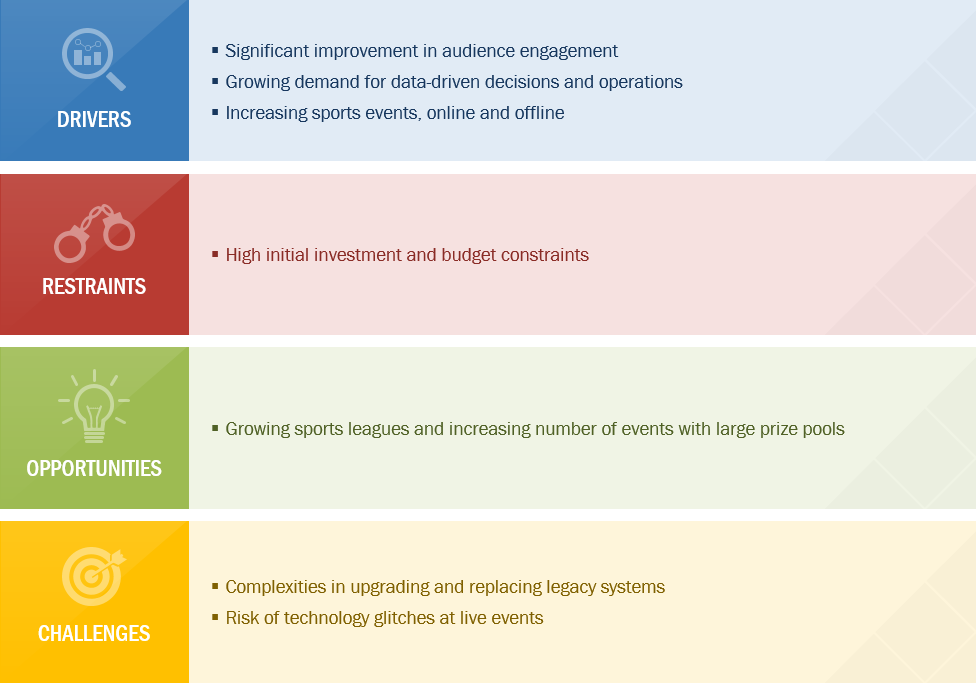
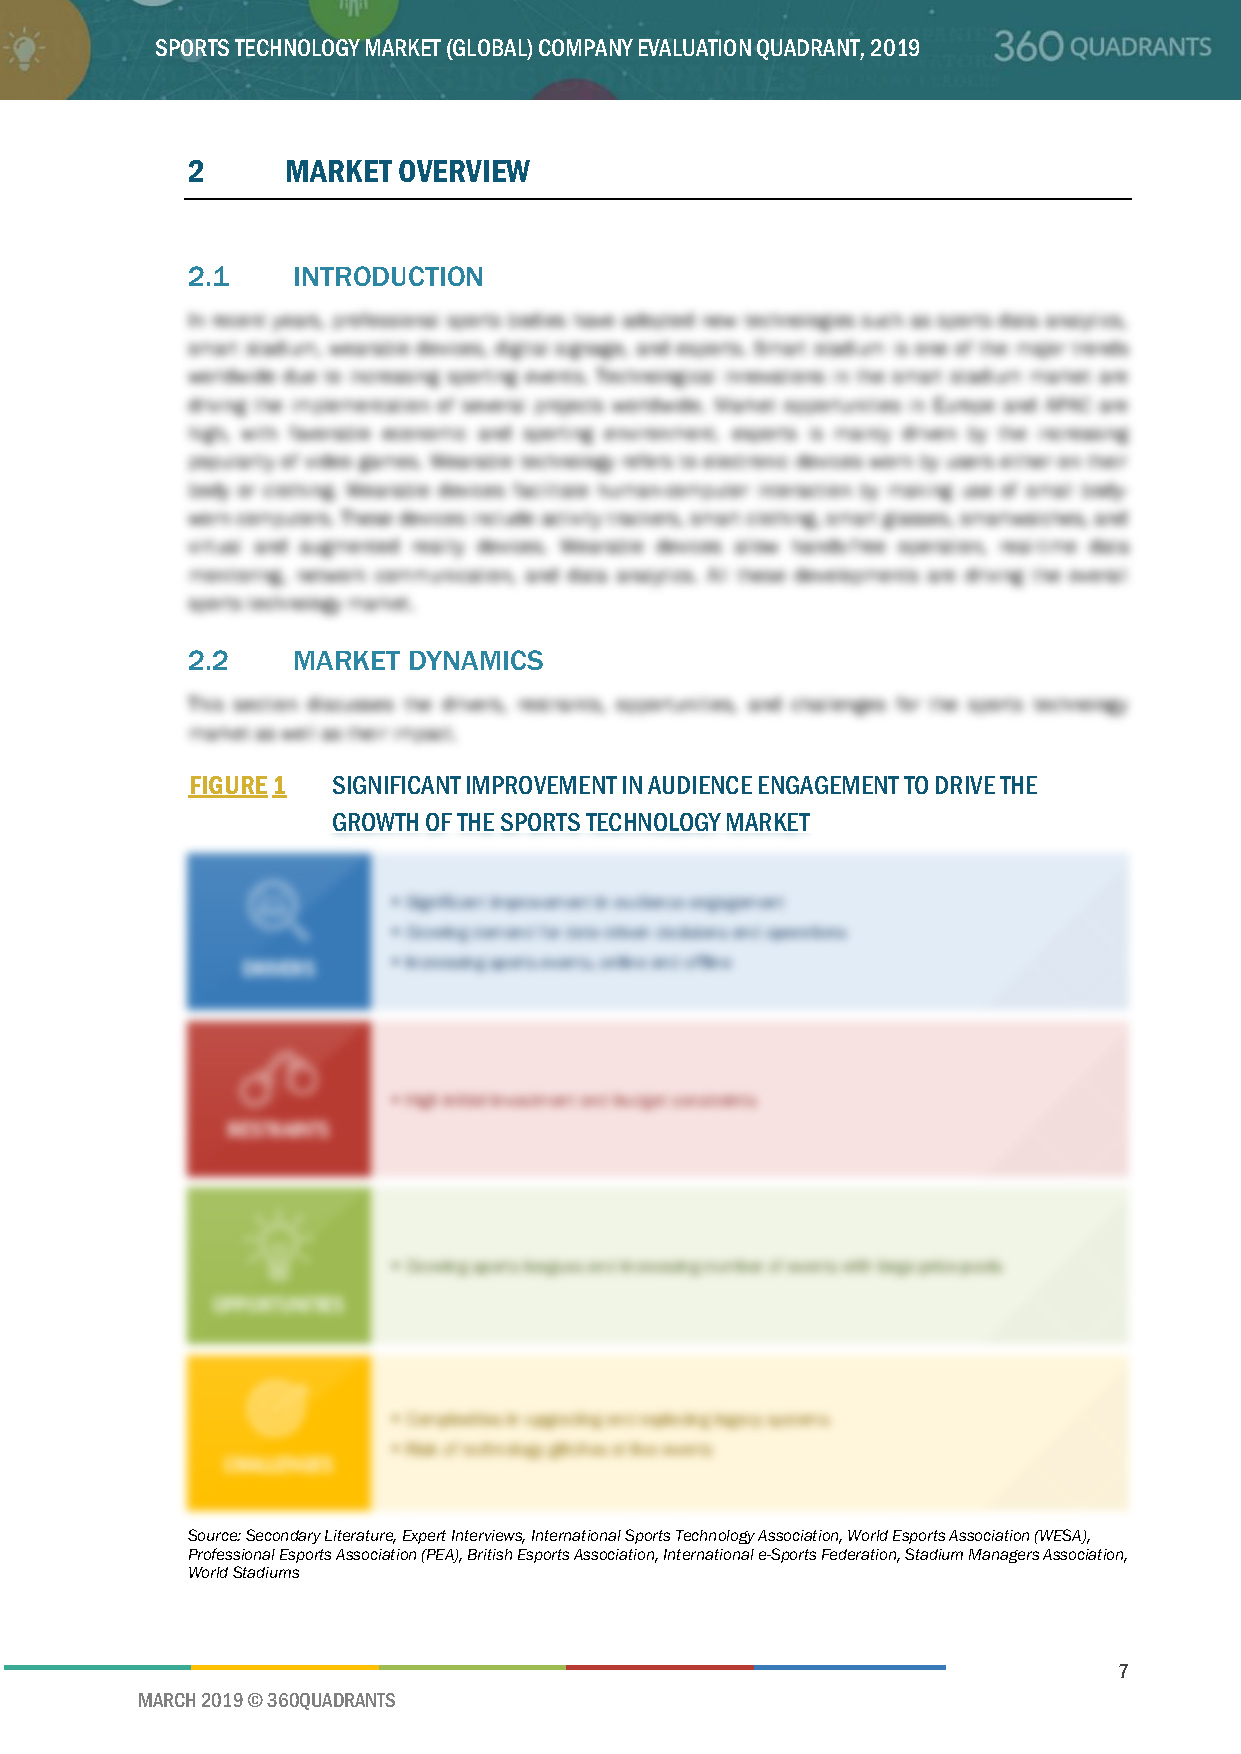
Figure 1 Significant Improvement in Audience Engagement Driving Sports Technology Market
2.2.1 Drivers
2.2.1.1 Significant Improvement in Audience Engagement
2.2.1.2 Growing Demand for Data-Driven Decisions and Operations
2.2.1.3 Increasing Sports Events, Online and Offline
2.2.2 Restraints
2.2.2.1 High Initial Investment and Budget Constraints
2.2.3 Opportunities
2.2.3.1 Growing Sports Leagues and Increasing Number of Events With Large Prize Pools
2.2.4 Challenges
2.2.4.1 Complexities in Upgrading and Replacing Legacy Systems
2.2.4.2 Risk of Technology Glitches at Live Events
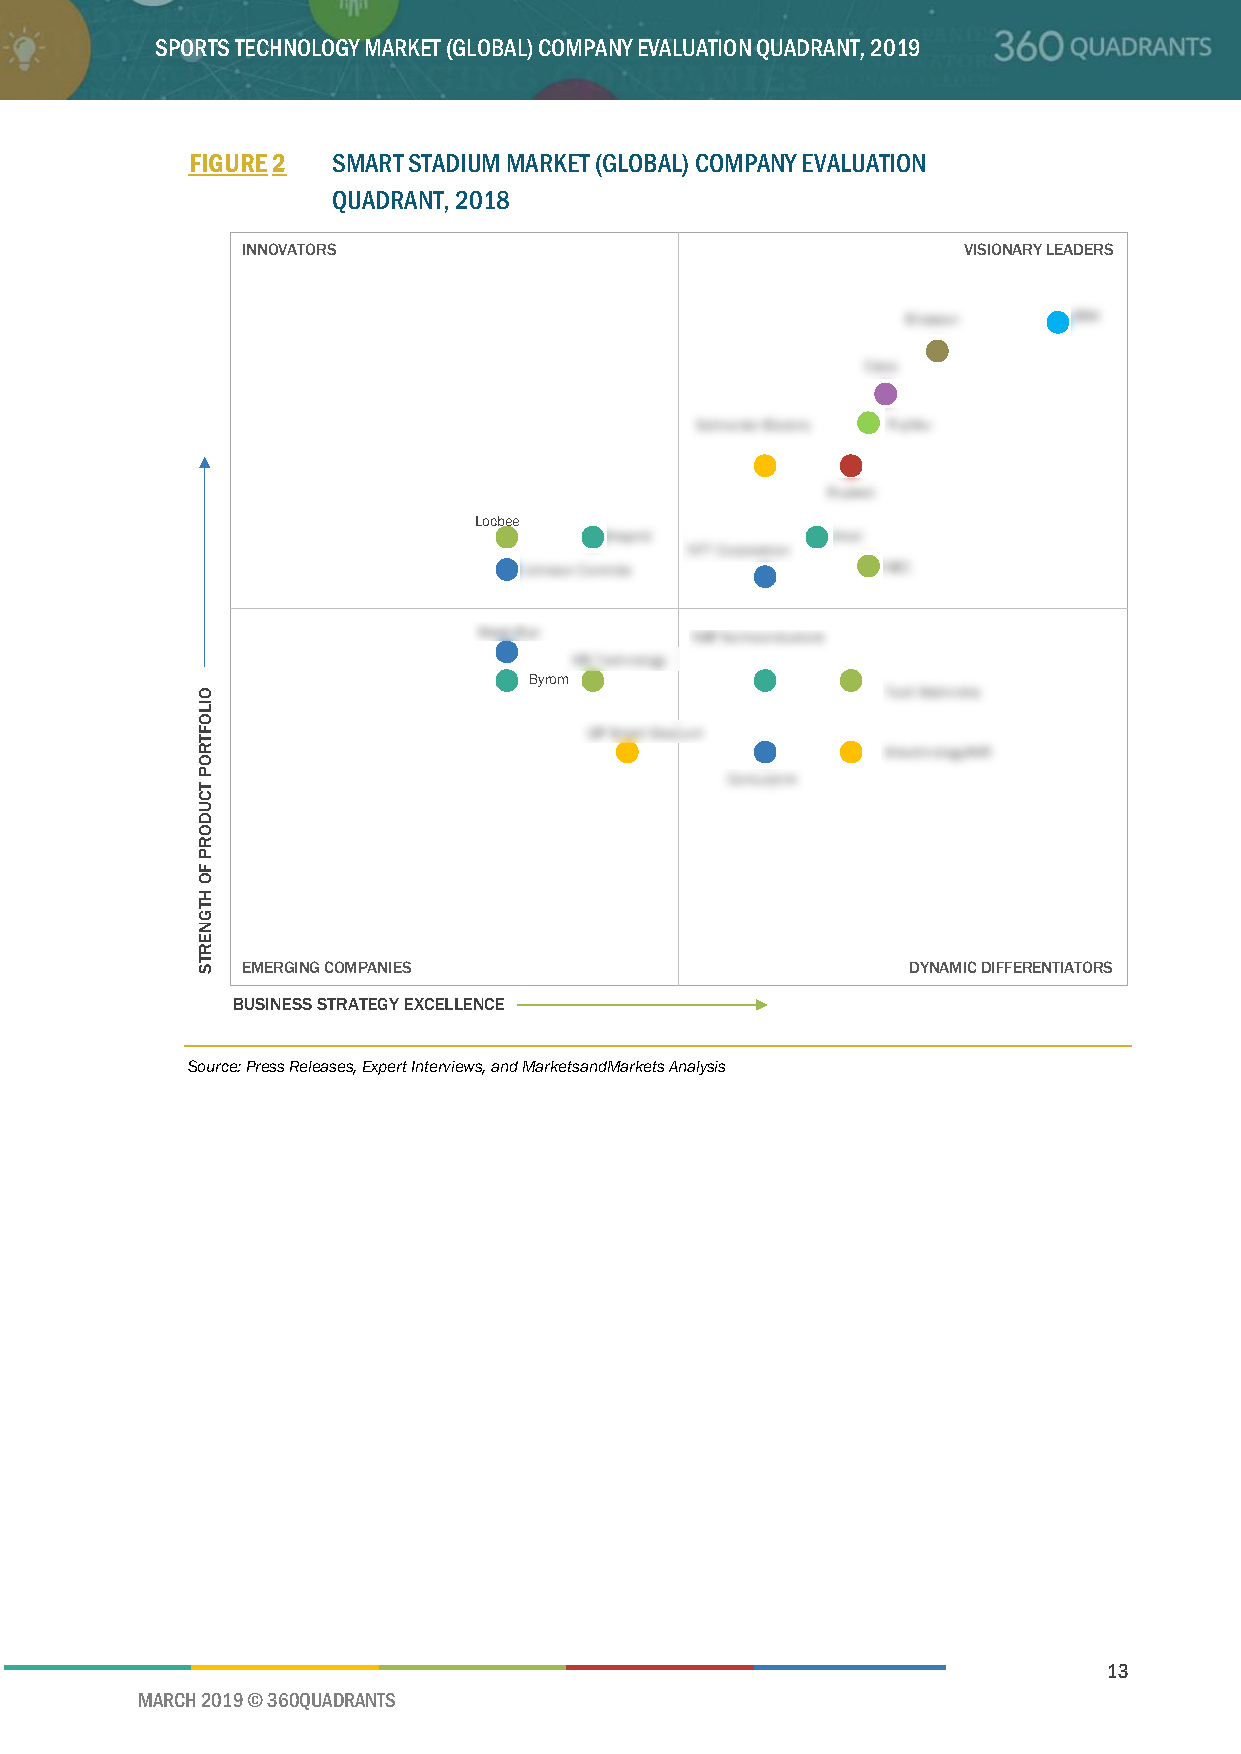
3 Competitive Evaluation Quadrant
3.1 Visionary Leaders
3.2 Innovators
3.3 Dynamic Differentiators
3.4 Emerging Companies
Figure 2 Smart Stadium Market (Global) Competitive Evaluation Quadrant, 2018
Figure 3 Sports Wearables Market (Global) Competitive Evaluation Quadrant, 2018
Figure 4 Esports Market (Global) Competitive Evaluation Quadrant, 2018
Figure 5 Sports Analytics Market (Global) Competitive Evaluation Quadrant, 2018
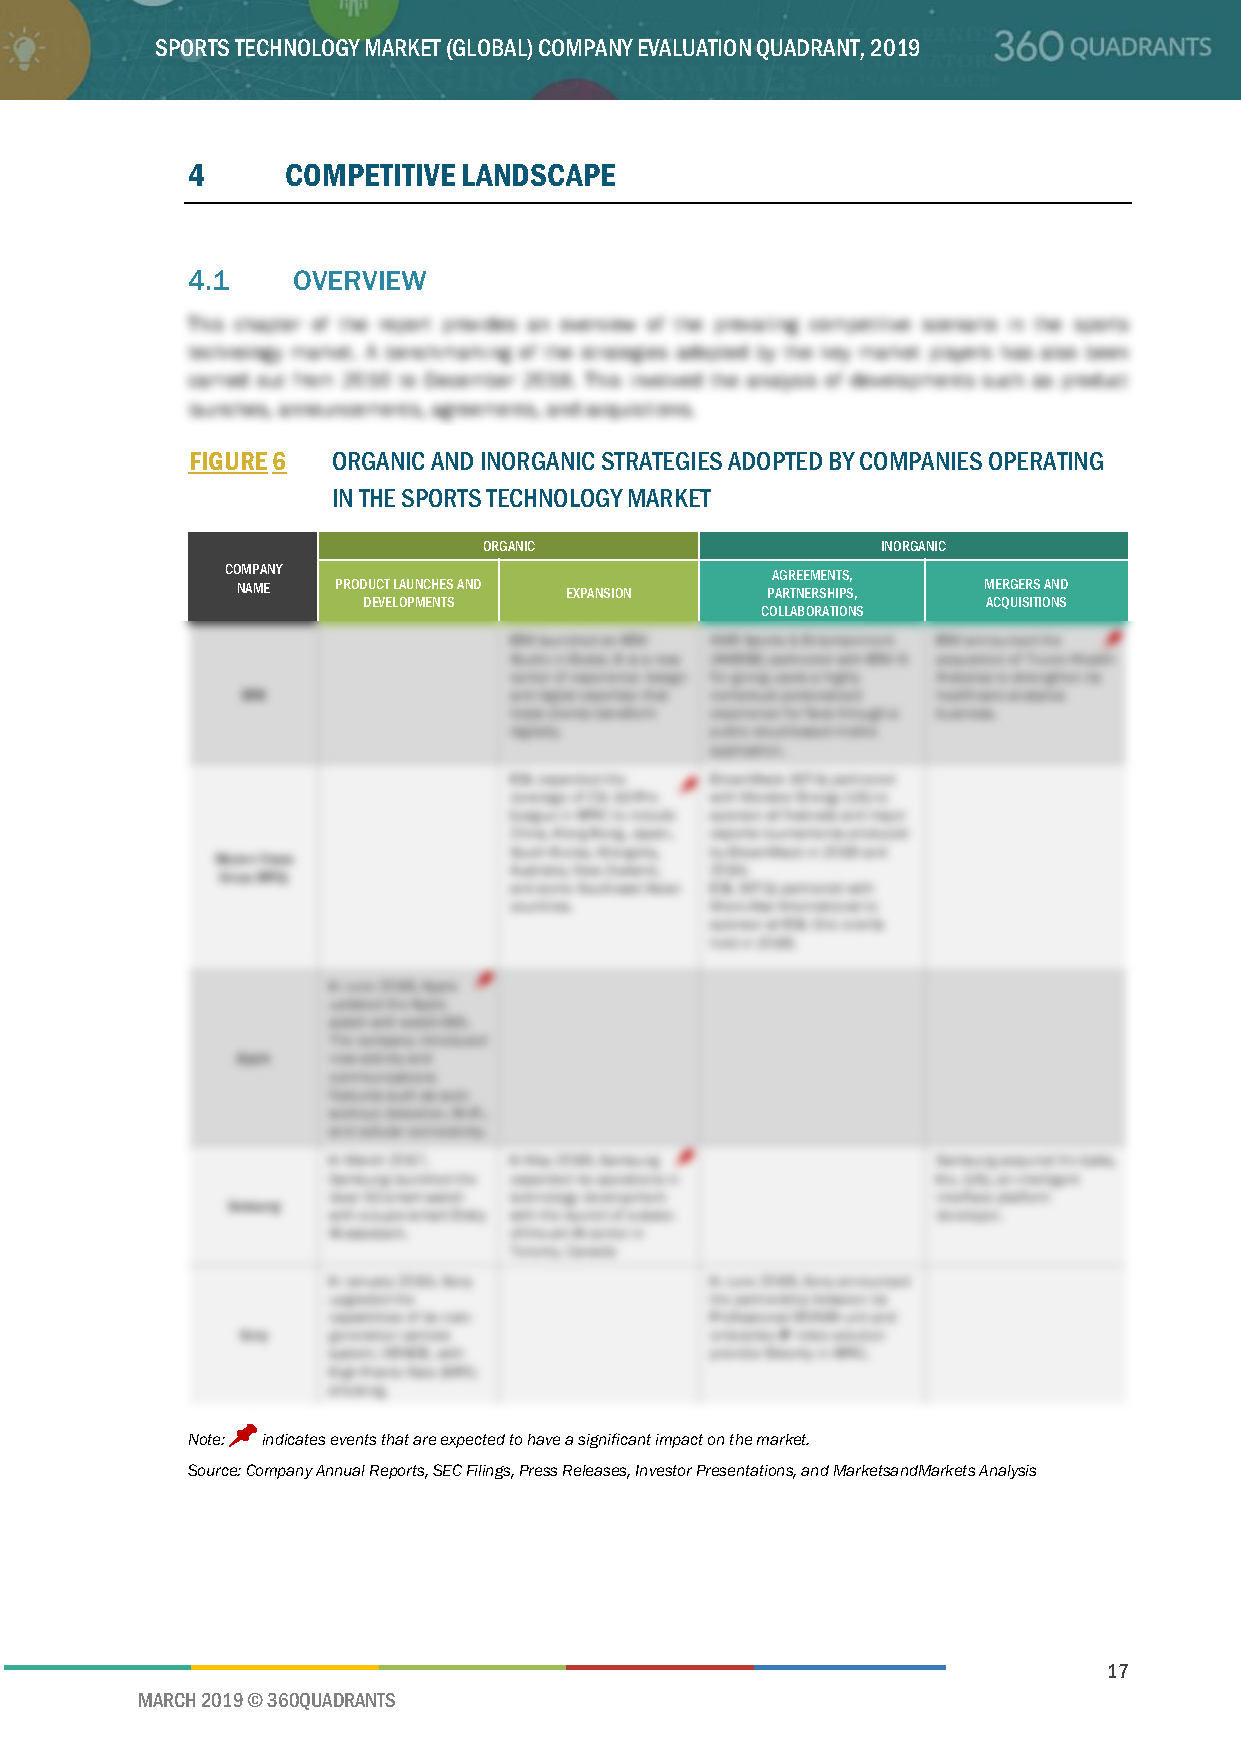
4 Competitive Landscape
4.1 Overview
Figure 6 Key Developments By Leading Players in Market From 2016 to 2018
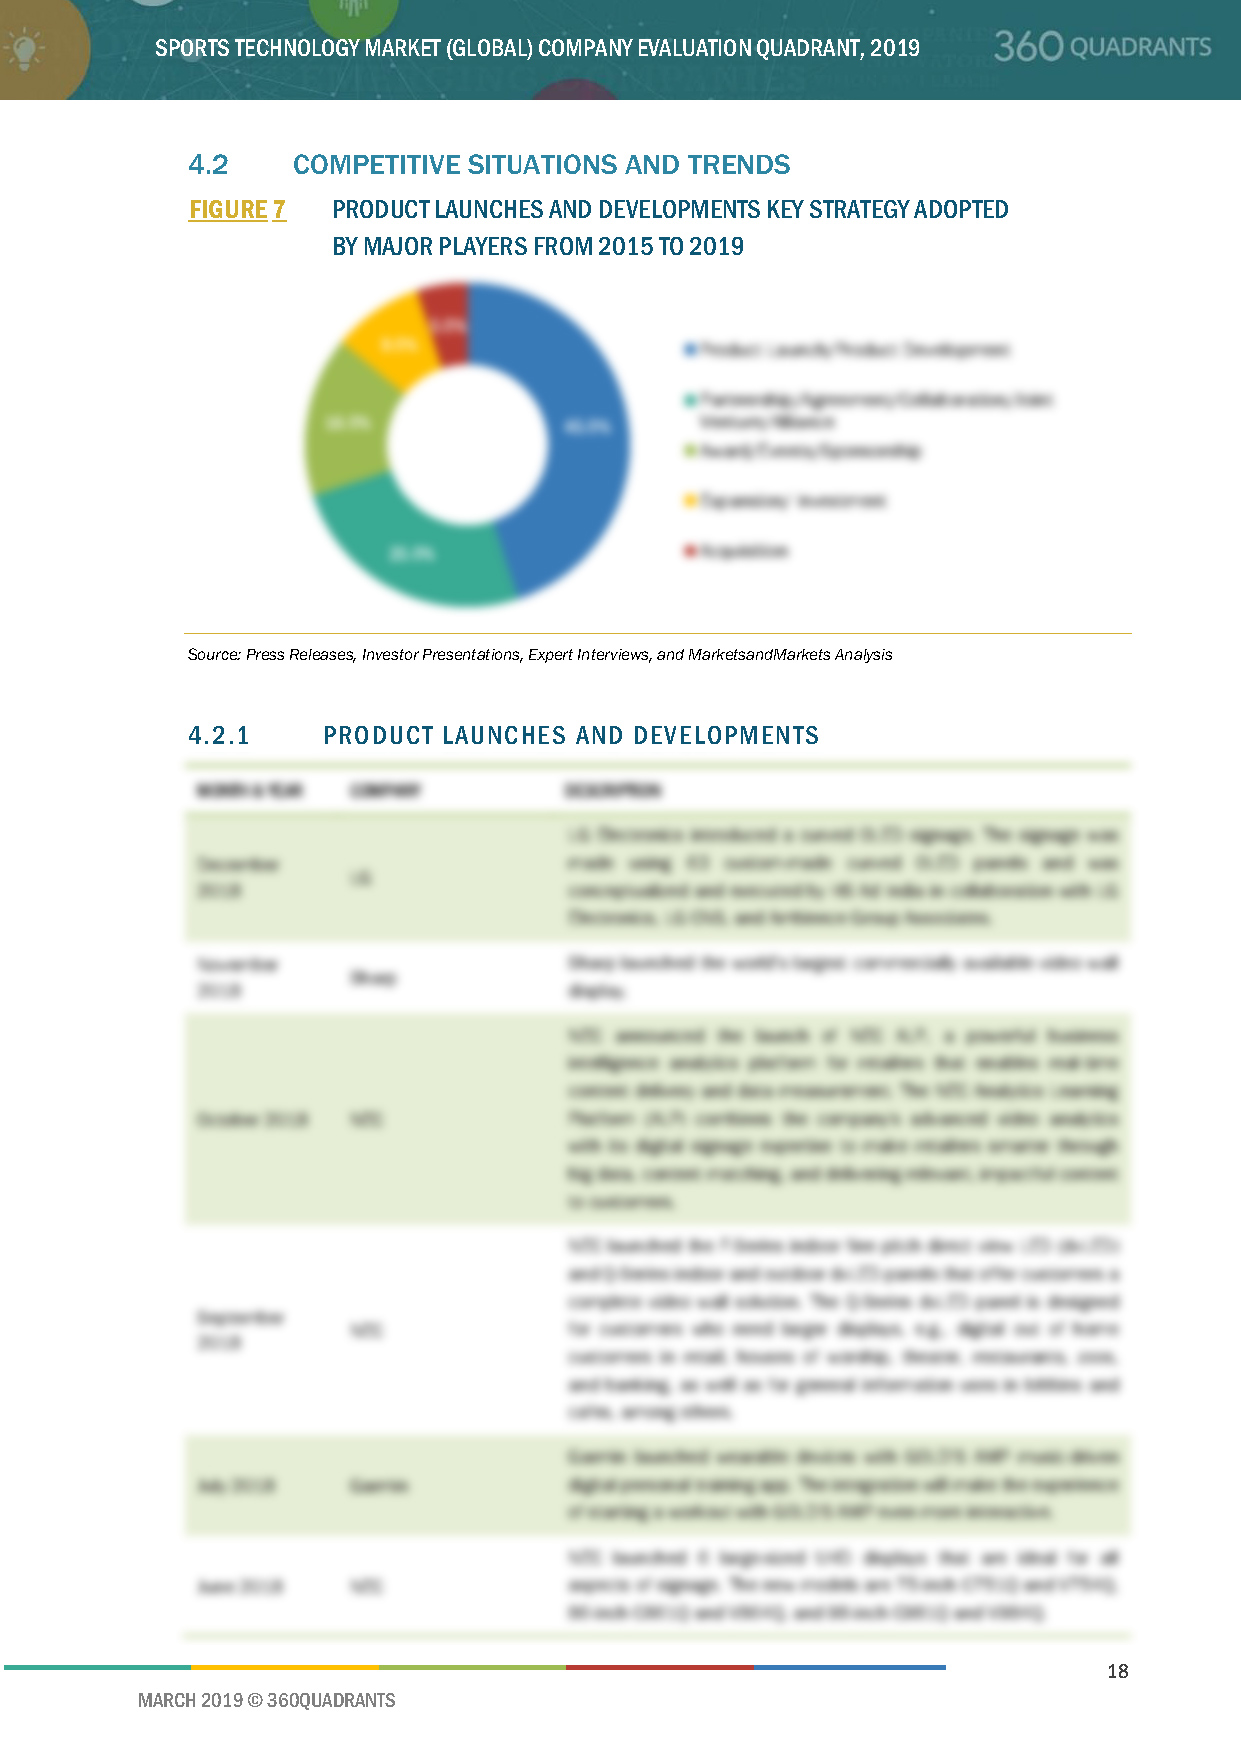
4.2 Competitive Situations and Trends
Figure 7 Product Launches and Developments Key Strategy Adopted By Major Players From 2015 to 2019
4.2.1 Product Launches and Developments
4.2.2 Partnership/Agreement/Collaboration/Joint Venture/Alliance
4.2.3 Award/Events/Sponsorship
4.2.4 Acquisition
4.2.5 Expansion/ Investment
5 Company Profiles
5.1 Introduction
5.2 Key Players
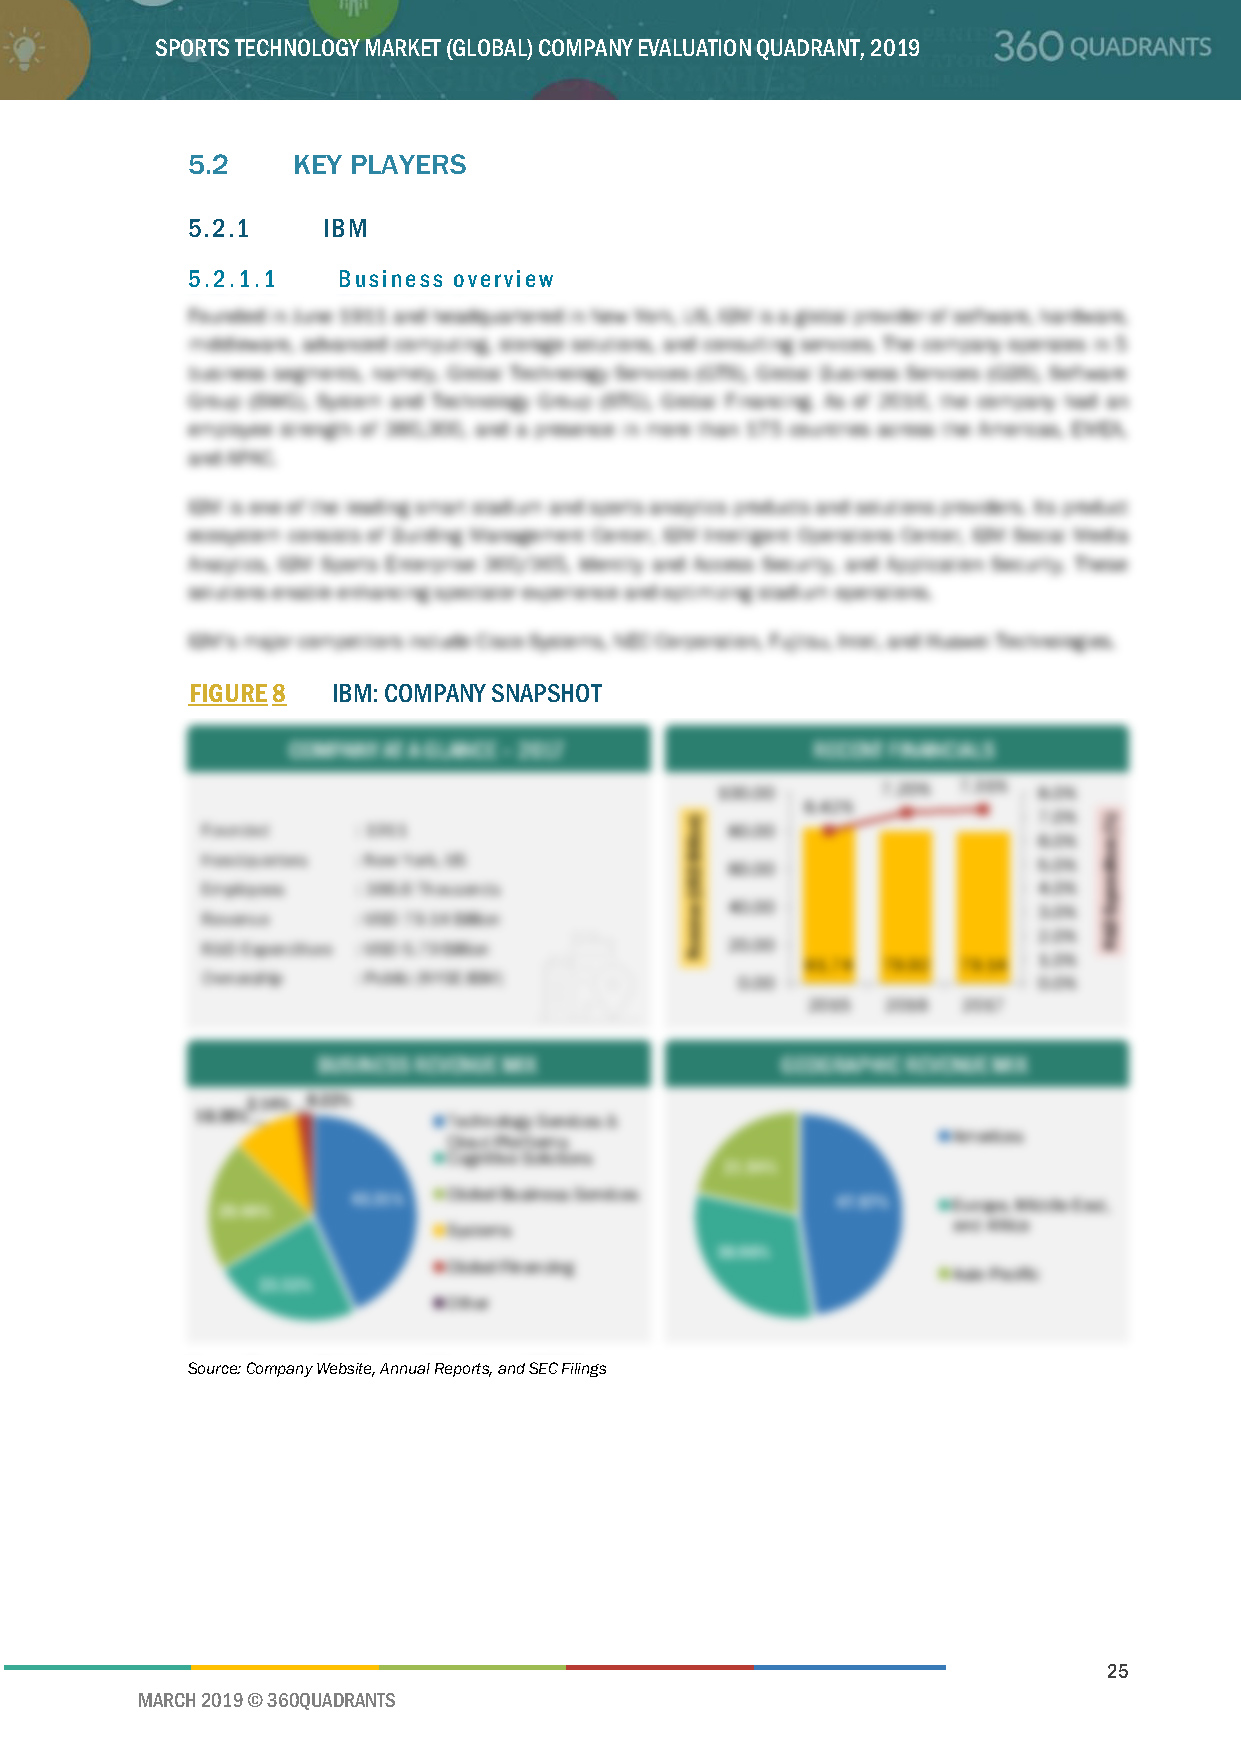
5.2.1 IBM
5.2.1.1 Business Overview*
Figure 8 IBM: Company Snapshot
5.2.1.2 Products/Services Offered*
5.2.1.3 Recent Developments*
5.2.1.4 SWOT Analysis*
5.2.1.5 MnM View*
(*Above sections are present for all of below companies)
5.2.2 Ericsson
Figure 9 Ericsson: Company Snapshot
5.2.3 Cisco
Figure 10 Cisco: Company Snapshot
5.2.4 Fujitsu
Figure 11 Fujitsu: Company Snapshot
5.2.5 SAP SE
Figure 12 SAP SE: Company Snapshot
5.2.6 Oracle
Figure 13 Oracle: Company Snapshot
5.2.7 NEC
Figure 14 NEC: Company Snapshot
5.2.8 LG
Figure 15 LG: Company Snapshot
5.2.9 Sharp
Figure 16 Sharp: Company Snapshot
5.2.10 Samsung
Figure 17 Samsung: Company Snapshot
5.2.11 Fitbit
Figure 18 Fitbit: Company Snapshot
5.2.12 Apple
Figure 19 Apple: Company Snapshot
5.2.13 Garmin
Figure 20 Garmin: Company Snapshot
5.2.14 Sony
Figure 21 Sony: Company Snapshot
5.2.15 ARRI
5.2.16 Panasonic Corporation
Figure 22 Panasonic Corporation: Company Snapshot
5.2.17 Modern Times Group
Figure 23 MTG: Company Snapshot
5.2.18 Activision Blizzard
Figure 24 Activision Blizzard: Company Snapshot
5.2.19 Valve Corporation
5.2.20 Tencent
Figure 25 Tencent: Company Snapshot
5.2.21 CJ Corporation
Figure 26 CJ Corporation: Company Snapshot
6 Appendix
6.1 Methodology
This report identifies and benchmarks the key market players in the Sports Technology market such as IBM (US), Ericsson (Sweden), Cisco (US), Fujitsu (Japan), SAP (Germany), Oracle (US), and evaluates them based on business strategy excellence and strength of product portfolio within the sports technology market ecosystem, combining inputs from various industry experts, buyers, and vendors, and extensive secondary research including annual reports, company press releases, investor presentations, free and paid company databases. They are rated and positioned on a 2x2 matrix, called as ‘Company Evaluation Quadrant,’ and identified as Visionary Leaders, Dynamic Differentiators, Innovators, or Emerging companies.
SAMPLES:
Personalize Your Research Requirement
- Updated version of this Quadrant
- Different Company Evaluation Quadrant
- 'Startup Only' Company Evaluation Quadrant
- Region or Country specific evaluation
- Application or Industry specific evaluation ..Read More
Analyst Briefing & Inquiry
- Submit a Briefing Request
- Question about our published research
- Request for evaluation of your organization for specific market
- Request for re-evaluation of Company Evaluation Quadrant ..Read More